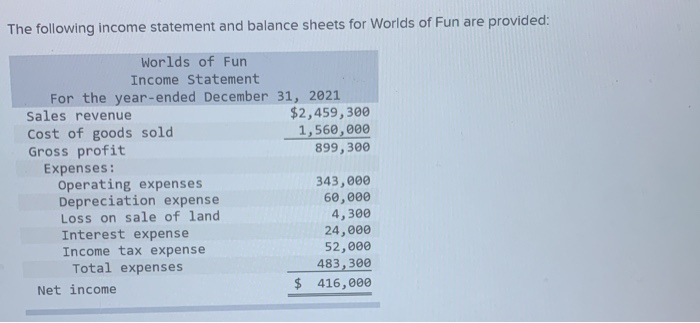
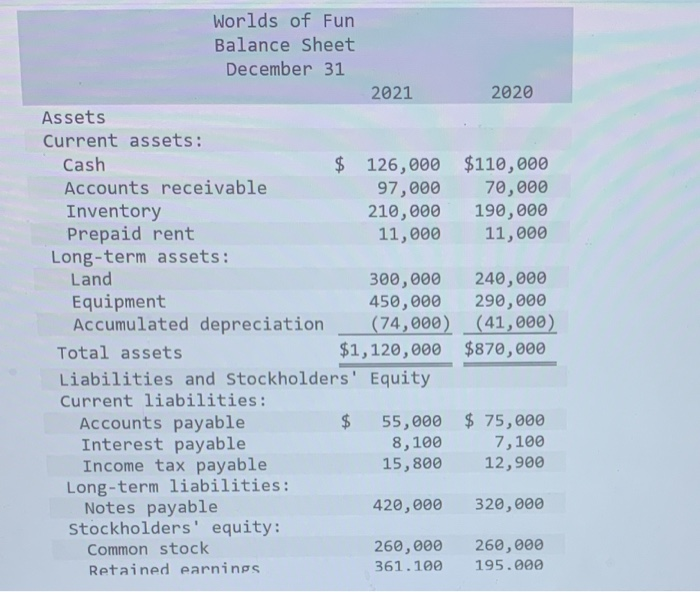
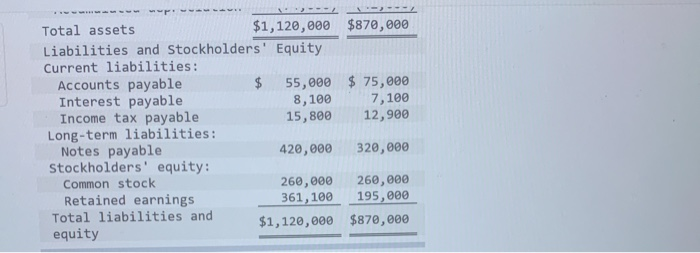
The following income statement and balance sheets for Worlds of Fun are provided: Worlds of Fun Income Statement For the year-ended December 31, 2021 Sales revenue $2,459,300 Cost of goods sold 1,560,000 Gross profit 899, 300 Expenses: Operating expenses 343,000 Depreciation expense 60,000 Loss on sale of land 4,300 Interest expense 24,000 Income tax expense 52,000 Total expenses 483,300 Net income $ 416,000 2020 $110,000 70,000 190,000 11,000 Worlds of Fun Balance Sheet December 31 2021 Assets Current assets: Cash $ 126,000 Accounts receivable 97,000 Inventory 210,000 Prepaid rent 11,000 Long-term assets: Land 300,000 Equipment 450,000 Accumulated depreciation (74,000) Total assets $1,120,000 Liabilities and Stockholders' Equity Current liabilities: Accounts payable 55,000 Interest payable 8,100 Income tax payable 15,800 Long-term liabilities: Notes payable 420,000 Stockholders' equity: Common stock 260,000 Retained earnings 361.100 240,000 290,000 (41,000) $870,000 $ 75,000 7,100 12,900 320,000 260,000 195.000 $870,000 $ 75,000 7,100 12,900 Total assets $1,120,000 Liabilities and Stockholders' Equity Current liabilities: Accounts payable $ 55,000 Interest payable 8,100 Income tax payable Long-term liabilities: Notes payable 420,000 Stockholders' equity: Common stock 260,000 Retained earnings 361,100 Total liabilities and $1,120,000 equity 320,000 260,000 195,000 $870,000 Earnings per share for the year ended December 31, 2021. Is $160. The closing stock price on December 31, 2021, is $35.50. Calculate the following profitability ratios for 2021: (Do not round intermediate calculations. Round your answers to 1 decimal place.) Profitability Ratios 1. Gross profit ratio 2. Return on assets 3. Profit margin 4 Asset turnover 5. Return on equity 6. Price-earnings ratio times times