Answered step by step
Verified Expert Solution
Link Copied!

Question

1 Approved Answer

[The following information applies to the questions displayed below. During the year, a company has the following inventory transactions. Date Transaction Jan. 1 Beginning inventory
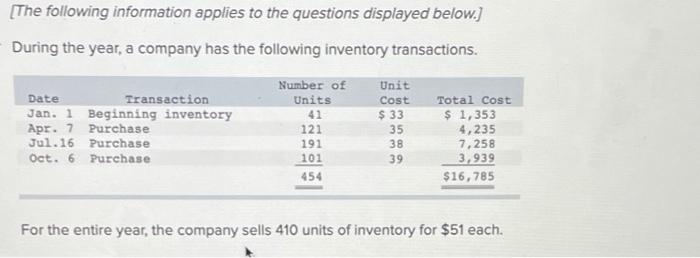
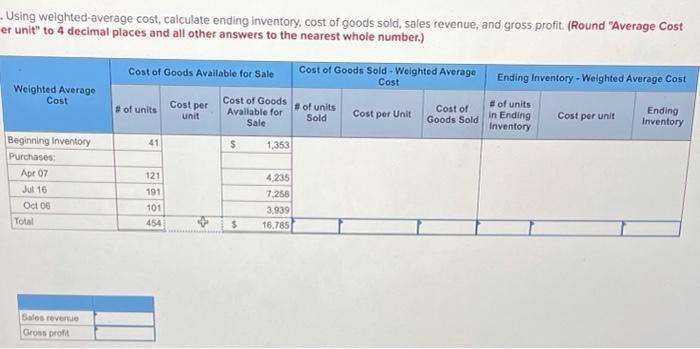
image text in transcribed
[The following information applies to the questions displayed below. During the year, a company has the following inventory transactions. Date Transaction Jan. 1 Beginning inventory Apr. 7 Purchase Jul.16 Purchase Oct. 6 Purchase Number of Units 41 121 191 101 454 Unit Cost $ 33 35 38 39 Total Cost $ 1,353 4,235 7,258 3,939 $16,785 For the entire year, the company sells 410 units of inventory for $51 each. - Using weighted average cost, calculate ending inventory cost of goods sold, sales revenue, and gross profit. (Round "Average Cost er unit" to 4 decimal places and all other answers to the nearest whole number.) Ending Inventory - Weighted Average Cost Weighted Average Cost Cost of Goods Available for Sale Cost of Goods Sold - Weighted Average Cost Cost of Goods # of units # of units Cost of unit Available for Cost per Unit Sold Sale Cost per #of units Goods Sold in Ending Cost per unit Ending Inventory Inventory 41 $ 1,353 Beginning Inventory Purchases Apr 07 Jul 16 Oct 06 Total 121 191 4.235 7.258 3.939 16.785 101 454 5 Sales revenue Gross pront

Step by Step Solution

There are 3 Steps involved in it

Step: 1

blur-text-image

Get Instant Access to Expert-Tailored Solutions

See step-by-step solutions with expert insights and AI powered tools for academic success

Step: 2

blur-text-image

Step: 3

blur-text-image

Ace Your Homework with AI

Get the answers you need in no time with our AI-driven, step-by-step assistance

Get Started

Recommended Textbook for

Knowledge Audit A Complete Guide

Authors: The Art Of Service - Knowledge Audit Publishing

2021 Edition

1867424010, 978-1867424017

More Books

Students also viewed these Accounting questions

Question

13.16. Derive the expected mean squares shown in Table 13.11.

Answered: 1 week ago