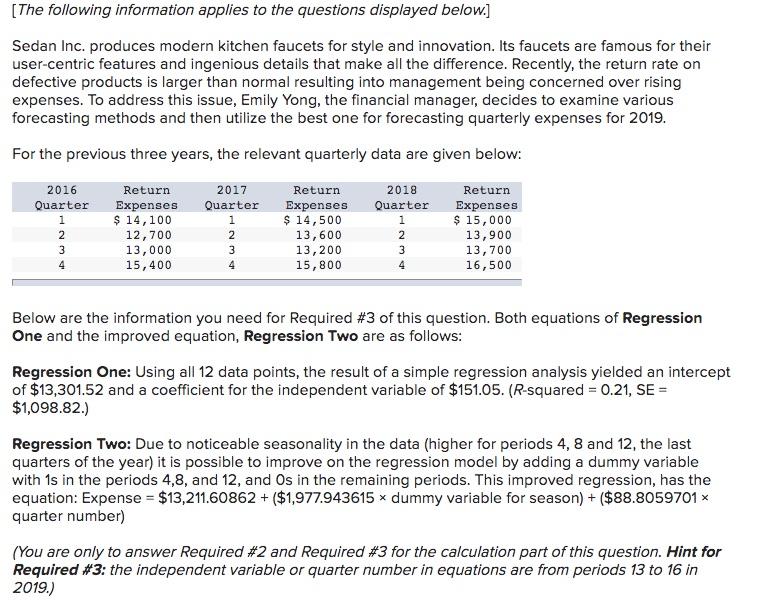
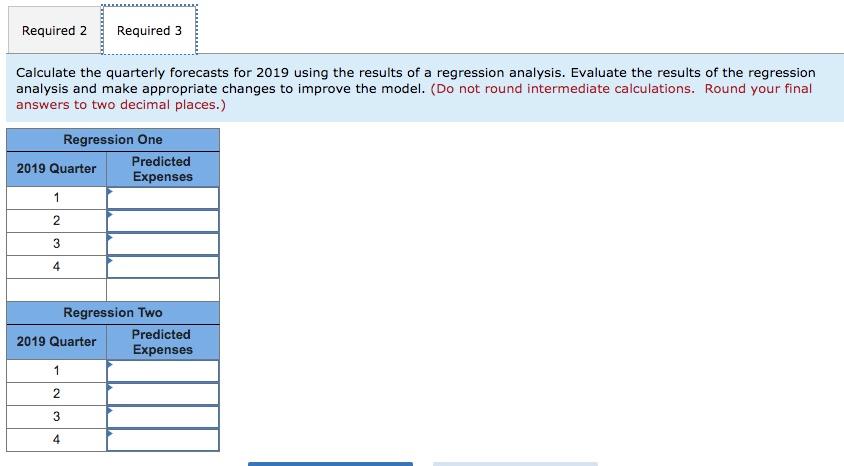
[The following information applies to the questions displayed below.] Sedan Inc. produces modern kitchen faucets for style and innovation. Its faucets are famous for their user-centric features and ingenious details that make all the difference. Recently, the return rate on defective products is larger than normal resulting into management being concerned over rising expenses. To address this issue, Emily Yong, the financial manager, decides to examine various forecasting methods and then utilize the best one for forecasting quarterly expenses for 2019. For the previous three years, the relevant quarterly data are given below: 2016 Return Return 2018 Return Quarter 2017 Quarter 1 Quarter 1 1 2 Expenses $ 14,100 12,700 13,000 15,400 2 Expenses $ 14,500 13,600 13,200 15,800 2 Expenses $ 15,000 13,900 13,700 16,500 3 3 3 4 4 4 Below are the information you need for Required #3 of this question. Both equations of Regression One and the improved equation, Regression Two are as follows: Regression One: Using all 12 data points, the result of a simple regression analysis yielded an intercept of $13,301.52 and a coefficient for the independent variable of $151.05. (R-squared = 0.21, SE = $1,098.82.) Regression Two: Due to noticeable seasonality in the data (higher for periods 4, 8 and 12, the last quarters of the year) it is possible to improve on the regression model by adding a dummy variable with 1s in the periods 4,8, and 12, and Os in the remaining periods. This improved regression, has the equation: Expense = $13,211.60862 + ($1,977.943615 dummy variable for season) + ($88.8059701 quarter number) (You are only to answer Required #2 and Required #3 for the calculation part of this question. Hint for Required #3: the independent variable or quarter number in equations are from periods 13 to 16 in 2019.) Required 2 Required 3 Calculate the quarterly forecasts for 2019 using the results of a regression analysis. Evaluate the results of the regression analysis and make appropriate changes to improve the model. (Do not round intermediate calculations. Round your final answers to two decimal places.) Regression One 2019 Quarter Predicted Expenses 1 2 3 4 Regression Two 2019 Quarter Predicted Expenses 1 2 3 4 [The following information applies to the questions displayed below.] Sedan Inc. produces modern kitchen faucets for style and innovation. Its faucets are famous for their user-centric features and ingenious details that make all the difference. Recently, the return rate on defective products is larger than normal resulting into management being concerned over rising expenses. To address this issue, Emily Yong, the financial manager, decides to examine various forecasting methods and then utilize the best one for forecasting quarterly expenses for 2019. For the previous three years, the relevant quarterly data are given below: 2016 Return Return 2018 Return Quarter 2017 Quarter 1 Quarter 1 1 2 Expenses $ 14,100 12,700 13,000 15,400 2 Expenses $ 14,500 13,600 13,200 15,800 2 Expenses $ 15,000 13,900 13,700 16,500 3 3 3 4 4 4 Below are the information you need for Required #3 of this question. Both equations of Regression One and the improved equation, Regression Two are as follows: Regression One: Using all 12 data points, the result of a simple regression analysis yielded an intercept of $13,301.52 and a coefficient for the independent variable of $151.05. (R-squared = 0.21, SE = $1,098.82.) Regression Two: Due to noticeable seasonality in the data (higher for periods 4, 8 and 12, the last quarters of the year) it is possible to improve on the regression model by adding a dummy variable with 1s in the periods 4,8, and 12, and Os in the remaining periods. This improved regression, has the equation: Expense = $13,211.60862 + ($1,977.943615 dummy variable for season) + ($88.8059701 quarter number) (You are only to answer Required #2 and Required #3 for the calculation part of this question. Hint for Required #3: the independent variable or quarter number in equations are from periods 13 to 16 in 2019.) Required 2 Required 3 Calculate the quarterly forecasts for 2019 using the results of a regression analysis. Evaluate the results of the regression analysis and make appropriate changes to improve the model. (Do not round intermediate calculations. Round your final answers to two decimal places.) Regression One 2019 Quarter Predicted Expenses 1 2 3 4 Regression Two 2019 Quarter Predicted Expenses 1 2 3 4