

Answered step by step
Verified Expert Solution
Question
1 Approved Answer
The following information applies to the questions displayed below/ Selected comparative financial statements of Korbin Company follow oints KORBIN COMPANY Comparative Income Statenents For Years
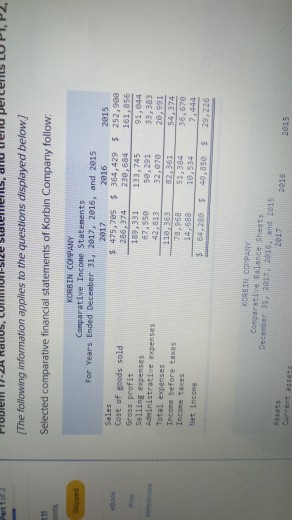
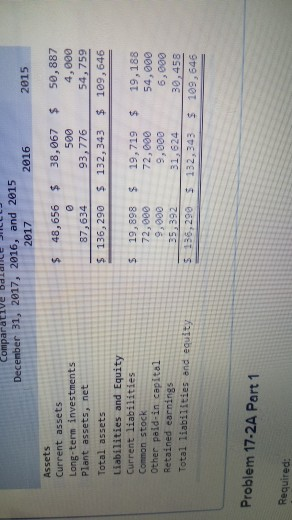
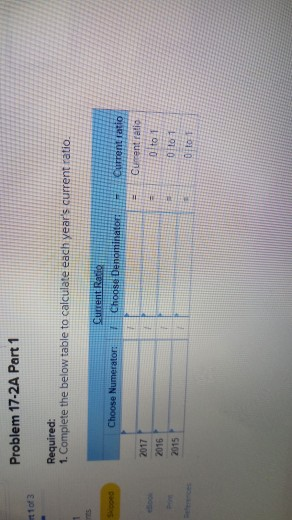
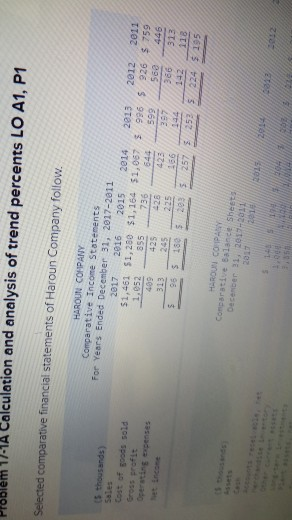
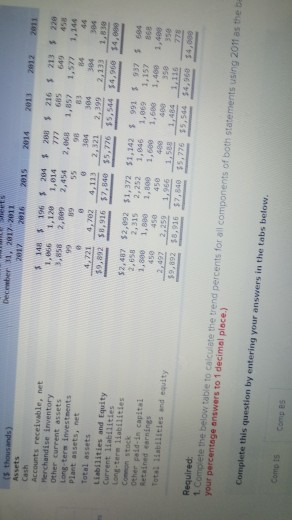
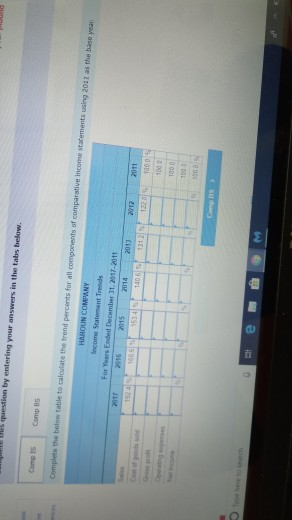
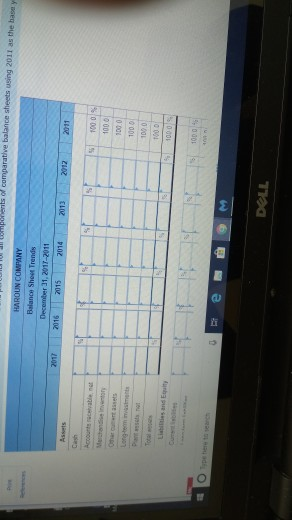
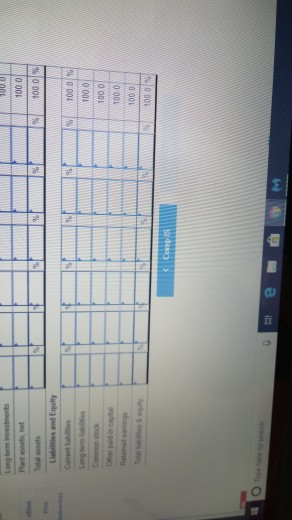
The following information applies to the questions displayed below/ Selected comparative financial statements of Korbin Company follow oints KORBIN COMPANY Comparative Income Statenents For Years Ended December 31, 2617, 2816, and 2815 2017 2816 2815 Sales Cost of goods sold Gross profit s 475,785 364,429 252,988 ,856 91,044 33,383 42,813 32,70 20,991 286.374 230,684 161 189,331 133,745 67,550 50,291 32,870 expensers Total expenses Income before taxes Income taxes Net Income 78,968 14,688 1 534 51,384 36,678 7,444 5 64,288 49,850 29,226 ORB IN COPPANY Decenbe Assets 2017 2916 2015 Comparative bdlance December 31, 2017, 2016, and 2015 2017 2016 2015 Assets Current assets Long-term investments Plant assets, net Total assets Liabilities and Equity Current liabilities Conmon stock Other paid-in capital Retained earnings Total liabilities end equity 48,656 38,067 50,887 87,634 136,290 4,000 54, 759 132,343 109,646 500 93,776 S 19,898 19,719 19,188 54,000 6,000 72,000 9,000 35,392 72,000 9,000 s 136,29 132,343 109, 646 Problem 17-2A Part 1 Required Problem 17-2A Part 1 Required: 1. Complete the below table to calculate each year's current ratio. 2017 0 to f o to 1 2015 Problem 17-1A Calculation and analysis of trend percents LO A1, P1 of Haroun Company follow 2817 2816 2015 20142e13 2012 2011 of goods sold 855 425 Decewber 11, 2017-2011 Assets S 148 $ 196 284 % 200 $ 216 $ 213 S 220 ,858 2,89 2,454 2,068 1,85 1,577 1,144 8 304 384 4384 $9,892 $8,916 $7,848 $5,776 $5,544 $4,968 $4,e98 1,666 1,128 1,814 7 65 649 Accounts receivable, net Herchandise inventory Other current assets Long-term investments Plant assets, net 84 4.721 4,782 4,1132,321,399 2,131.839 Total assets Liabilities and Equity Current 1iabilitles s 991 937 584 $2,487 $2,092 $1,372 $1,142 % 991 $ 937 604 868 1,800 1,880 1,800 1,68 1,68 1,408 1,48e Common stock Other peld-in capital 450450 458 498 409 359 35e Required 1. Complete the below table to calculate the trend percents for all components of both statements using 2011 as theb your percentage answers to 1 decimal place.) Complete this question by entering your answers in the tabs below. Comp ts Comp es Income Statement Trends 2014 2013 IL
Step by Step Solution
There are 3 Steps involved in it
Step: 1

Get Instant Access to Expert-Tailored Solutions
See step-by-step solutions with expert insights and AI powered tools for academic success
Step: 2

Step: 3
Ace Your Homework with AI
Get the answers you need in no time with our AI-driven, step-by-step assistance
Get Started
2001 Miller Local Government Audits
Authors: Rhett D. Harrell
1st Edition
015607219X, 978-0156072199