Answered step by step
Verified Expert Solution
Link Copied!

Question

1 Approved Answer

The following information applies to the questions displayed below. Selected comparative financial statements of Korbin Company follow: KORBIN COMPANY Comparative Income Statements For Years Ended
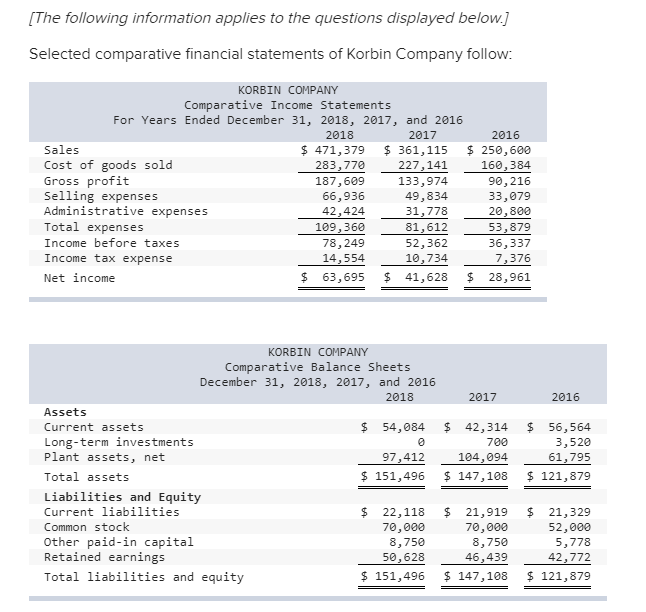
image text in transcribedimage text in transcribedimage text in transcribedimage text in transcribed

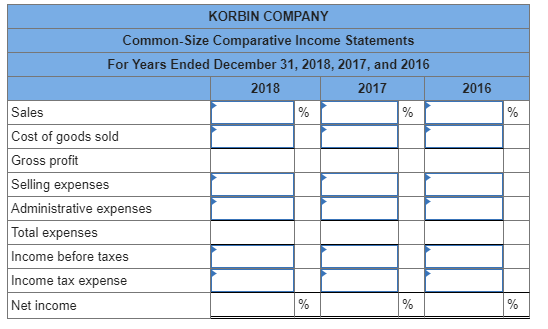
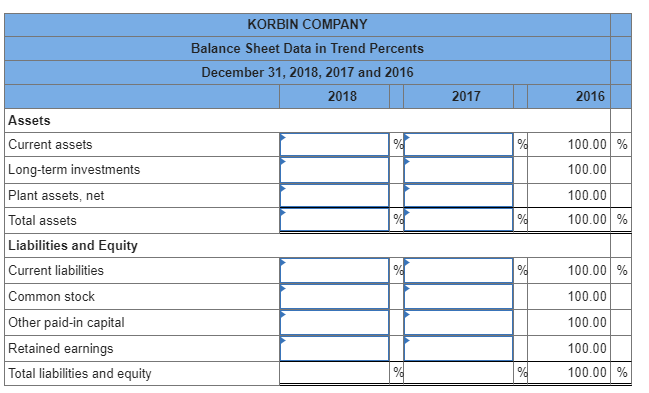
The following information applies to the questions displayed below. Selected comparative financial statements of Korbin Company follow: KORBIN COMPANY Comparative Income Statements For Years Ended December 31, 2018, 2017, and 2016 2018 2017 2016 Sales $ 471,379 $ 361,115 $ 250,600 Cost of goods sold 283,770 227, 141 160,384 Gross profit 187,609 133,974 90,216 Selling expenses 66,936 49,834 33,079 Administrative expenses 42,424 31,778 20,800 Total expenses 109,360 81,612 53,879 Income before taxes 78,249 52,362 36,337 Income tax expense 14,554 10,734 7,376 Net income $ 63,695 $ 41,628 $ 28,961 2017 2016 KORBIN COMPANY Comparative Balance Sheets December 31, 2018, 2017, and 2016 2018 Assets Current assets $ 54,084 Long-term investments Plant assets, net 97,412 Total assets $ 151,496 Liabilities and Equity Current liabilities $ 22,118 Common stock 70,000 Other paid-in capital 8,750 Retained earnings 50,628 Total liabilities and equity $ 151,496 $ 42,314 700 104,094 $ 147, 108 $ 56,564 3,520 61,795 $ 121,879 $ 21,919 70,000 8,750 46,439 $ 147,108 $ 21,329 52,000 5,778 42,772 $ 121,879 Current Ratio 1 Choose Denominator: Choose Numerator: - Current ratio Current ratio 0 to 1 2018: 2017: 2016: 0 to 1 0 to 1 2016 % KORBIN COMPANY Common-Size Comparative Income Statements For Years Ended December 31, 2018, 2017 and 2016 2018 2017 Sales Cost of goods sold Gross profit Selling expenses Administrative expenses Total expenses Income before taxes Income tax expense Net income KORBIN COMPANY Balance Sheet Data in Trend Percents December 31, 2018, 2017 and 2016 2018 2017 2016 Assets Current assets Long-term investments % 100.00 % 100.00 100.00 100.00 % Plant assets, net % 9 100.00 % Total assets Liabilities and Equity Current liabilities Common stock Other paid-in capital Retained earnings Total liabilities and equity 100.00 100.00 100.00 100.00 % %
Step by Step Solution

There are 3 Steps involved in it

Step: 1

blur-text-image

Get Instant Access to Expert-Tailored Solutions

See step-by-step solutions with expert insights and AI powered tools for academic success

Step: 2

blur-text-image_2

Step: 3

blur-text-image_3

Ace Your Homework with AI

Get the answers you need in no time with our AI-driven, step-by-step assistance

Get Started

Recommended Textbook for

Financial Accounting For Executives And MBAs

Authors: Ferris & Wallace

2nd Edition

1934319627, 978-1934319628

More Books

Students also viewed these Accounting questions

Question

What are some external indicators of impairment?

Answered: 1 week ago

Question

3. Is it a topic that your audience will find worthwhile?

Answered: 1 week ago

Question

2. Does the topic meet the criteria specified in the assignment?

Answered: 1 week ago