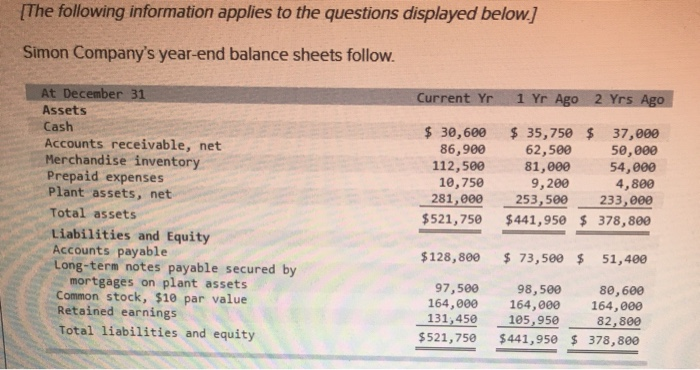
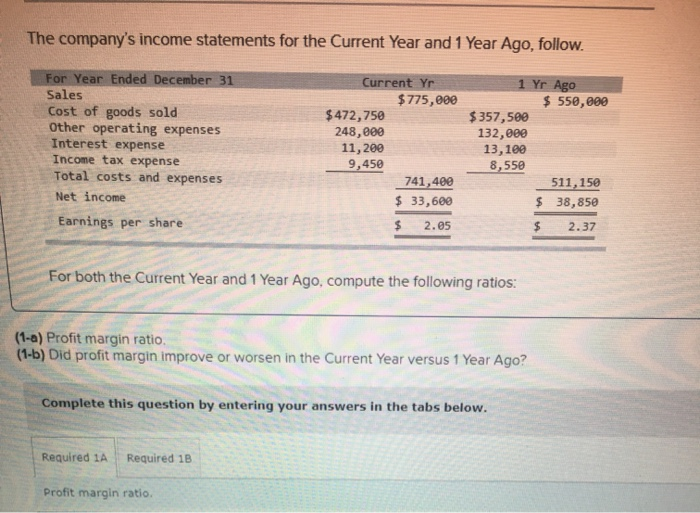
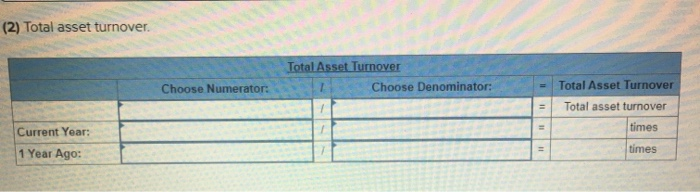
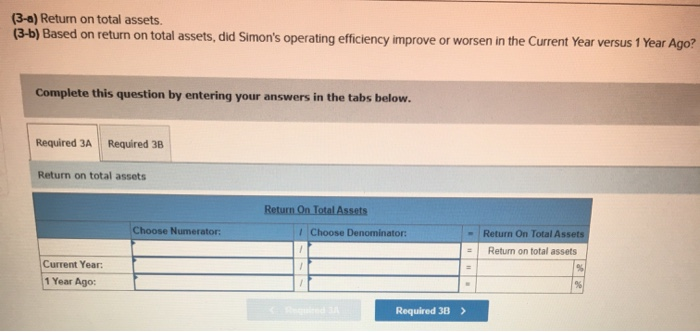
[The following information applies to the questions displayed below.] Simon Company's year-end balance sheets follow. Current Yr 1 Yr Ago 2 Yrs Ago At December 31 Assets Cash Accounts receivable, net Merchandise inventory Prepaid expenses Plant assets, net Total assets Liabilities and Equity Accounts payable Long-term notes payable secured by mortgages on plant assets Common stock, $10 par value Retained earnings Total liabilities and equity $ 30,689 86,900 112,500 10,750 281,000 $521,750 $ 35,750 $ 37,080 62,500 50,000 81,000 54,000 9,200 4,800 253,500 233,000 $441,950 $ 378, 800 $128,800 $ 73,500 $ 51,400 97,500 164,000 131,450 $521,750 98,500 164,000 105,950 $441.95A 80,600 164,000 82,800 378 Rea The company's income statements for the Current Year and 1 Year Ago, follow. For Year Ended December 31 Sales Cost of goods sold Other operating expenses Interest expense Income tax expense Total costs and expenses Net income Earnings per share Current Yr $775,000 $472,750 248,000 11,200 9,450 741,400 $ 33,600 $ 2.05 1 Yr Ago $ 550,000 $357,500 132,000 13,100 8,550 511,150 $ 38,850 $ 2.37 For both the Current Year and 1 Year Ago, compute the following ratios: (1-a) Profit margin ratio. (1-b) Did profit margin improve or worsen in the Current Year versus 1 Year Ago? Complete this question by entering your answers in the tabs below. Required 1A Required 1B Profit margin ratio The company's income statements for the Current Year and 1 Year Ago, follow. For Year Ended December 31 Sales Cost of goods sold Other operating expenses Interest expense Income tax expense Total costs and expenses Net income Earnings per share Current Yr $775,000 $472,750 248,000 11,200 9,450 741,400 $ 33,600 $ 2.05 1 Yr Ago $ 550,000 $357,500 132,000 13,100 8,550 511,150 $ 38,850 $ 2.37 For both the Current Year and 1 Year Ago, compute the following ratios: (1-a) Profit margin ratio. (1-b) Did profit margin improve or worsen in the Current Year versus 1 Year Ago? Complete this question by entering your answers in the tabs below. Required 1A Required 1B Profit margin ratio (2) Total asset turnover. Total Asset Turnover Choose Denominator: Choose Numerator: - = Total Asset Turnover Total asset turnover times Current Year: 1 Year Ago: times (3-a) Return on total assets. (3-b) Based on return on total assets, did Simon's operating efficiency improve or worsen in the Current Year versus 1 Year Ago? Complete this question by entering your answers in the tabs below. Required 3A Required 3B Return on total assets Return On Total Assets 1 Choose Denominator: Choose Numerator che - Return On Total Assets Return on total assets Current Year 1 Year Ago: Required 38 >