Answered step by step
Verified Expert Solution
Question
1 Approved Answer
The following information applies to the questions displayed below.) Simon Company's year-end balance sheets follow. Current Yr 1 Yr Ago 2 Yrs Ago At December
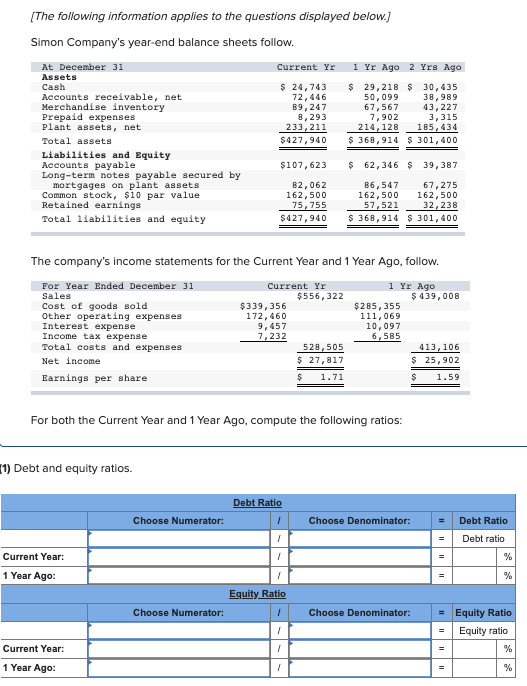
The following information applies to the questions displayed below.) Simon Company's year-end balance sheets follow. Current Yr 1 Yr Ago 2 Yrs Ago At December 31 Assets cash Accounts receivable, net Merchandise inventory Prepaid expenses Plant assets, net Total assets Liabilities and Equity Accounts payable Long-term notes payable secured by mortgages on plant assets Common stock, $10 par value Retained earnings Total liabilities and equity S 24.743 72.446 89,247 8,293 233, 211 $427,940 S 29.218 S 30.435 50,09938,989 67,567 43.227 7,902 3.315 214,128 185, 434 $ 368,914 $ 301,400 $107,623 $ 62,346 $ 39,387 B2,062 162.500 75, 755 $427,940 86,547 67,275 162,500 162.500 57,521 32,238 $ 368,914 $ 301,400 The company's income statements for the Current Year and 1 Year Ago, follow. For Year Ended December 31 Sales Cost of goods sold Other operating expenses Interest expense Income tax expense Total costs and expenses Net income Current Yr $556, 322 $339, 356 172,460 9,457 1 Yr Ago $ 439,008 $285, 355 111,069 10,097 6,585 413,106 $ 25,902 7,232 528.505 Earnings per share $ 1.59 For both the Current Year and 1 Year Ago, compute the following ratios: 11) Debt and equity ratios. Debt Ratio 7 Choose Numerator: Choose Denominator: = Debt Ratio Debt ratio Current Year: 1 Year Ago: Equity Ratio Choose Numerator: Choose Denominator: = = Equity Ratio Equity ratio Current Year: 1 Year Ago
Step by Step Solution
There are 3 Steps involved in it
Step: 1
Get Instant Access to Expert-Tailored Solutions
See step-by-step solutions with expert insights and AI powered tools for academic success
Step: 2
Step: 3
Ace Your Homework with AI
Get the answers you need in no time with our AI-driven, step-by-step assistance
Get Started