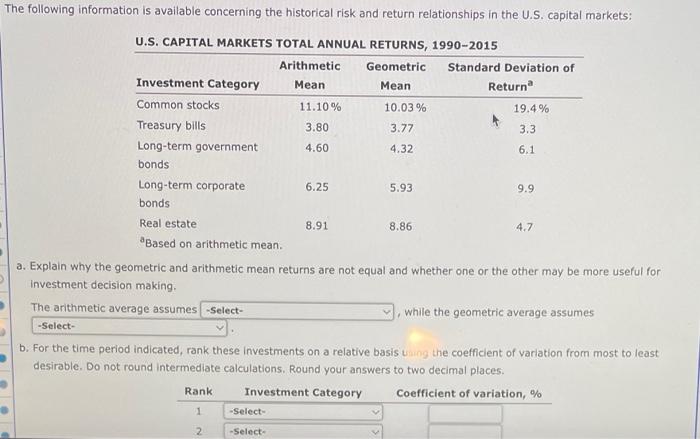
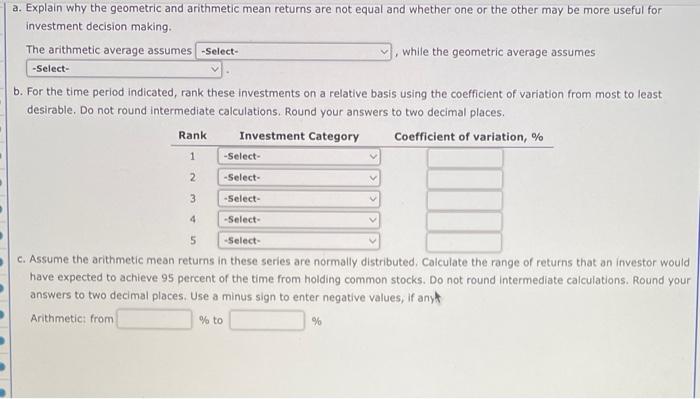
The following information is available concerning the historical risk and return relationships in the U.S. capital markets: U.S. CAPITAL MARKETS TOTAL ANNUAL RETURNS, 1990-2015 Arithmetic Geometric Standard Deviation of Investment Category Mean Mean Return Common stocks 11.10% 10.03% 19.4% Treasury bills 3.80 3.77 3.3 Long-term government 4.60 4.32 6.1 bonds Long-term corporate 6.25 5.93 9.9 bonds Real estate 8.91 8.86 4.7 Based on arithmetic mean. a. Explain why the geometric and arithmetic mean returns are not equal and whether one or the other may be more useful for Investment decision making. The arithmetic average assumes -Select- , while the geometric average assumes -Select- b. For the time period indicated, rank these investments on a relative basis using the coefficient of variation from most to least desirable. Do not round intermediate calculations. Round your answers to two decimal places. Rank Investment Category Coefficient of variation, % 1 -Select- 2 -Select- a. Explain why the geometric and arithmetic mean returns are not equal and whether one or the other may be more useful for investment decision making. The arithmetic average assumes -Select- while the geometric average assumes -Select- b. For the time period indicated, rank these investments on a relative basis using the coefficient of variation from most to least desirable. Do not round intermediate calculations. Round your answers to two decimal places, Rank Investment Category Coefficient of variation, % 1 -Select- 2 -Select- 3 -Select- 4 -Select- 5 -Select- c. Assume the arithmetic mean returns in these series are normally distributed. Calculate the range of returns that an investor would have expected to achieve 95 percent of the time from holding common stocks. Do not round Intermediate calculations. Round your answers to two decimal places. Use a minus sign to enter negative values, if any Arithmetic: from % to %