

Answered step by step
Verified Expert Solution
Question
1 Approved Answer
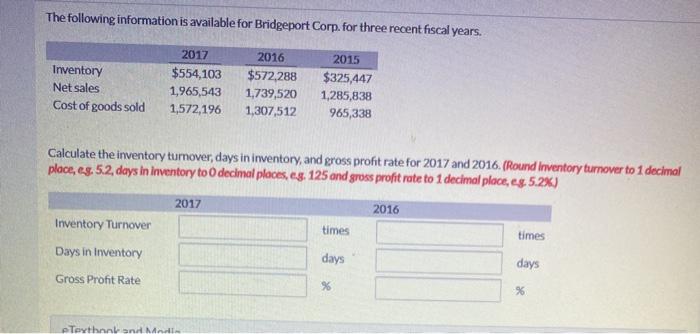
The following information is available for Bridgeport Corp. for three recent fiscal years. Inventory Net sales Cost of goods sold 2017 $554,103 1,965,543 1,572,196 2016
Step by Step Solution
There are 3 Steps involved in it
Step: 1

Get Instant Access to Expert-Tailored Solutions
See step-by-step solutions with expert insights and AI powered tools for academic success
Step: 2

Step: 3
Ace Your Homework with AI
Get the answers you need in no time with our AI-driven, step-by-step assistance
Get Started
ISO IEC 27001 Lead Auditor Mastering ISMS Audit Techniques
Authors: Dr Tamuka Maziriri
1st Edition
107903160X, 978-1079031607