The following information is from an Amazon case study. How would you analyze the data? Are they trending in the right direction? Suggestions for improvements?
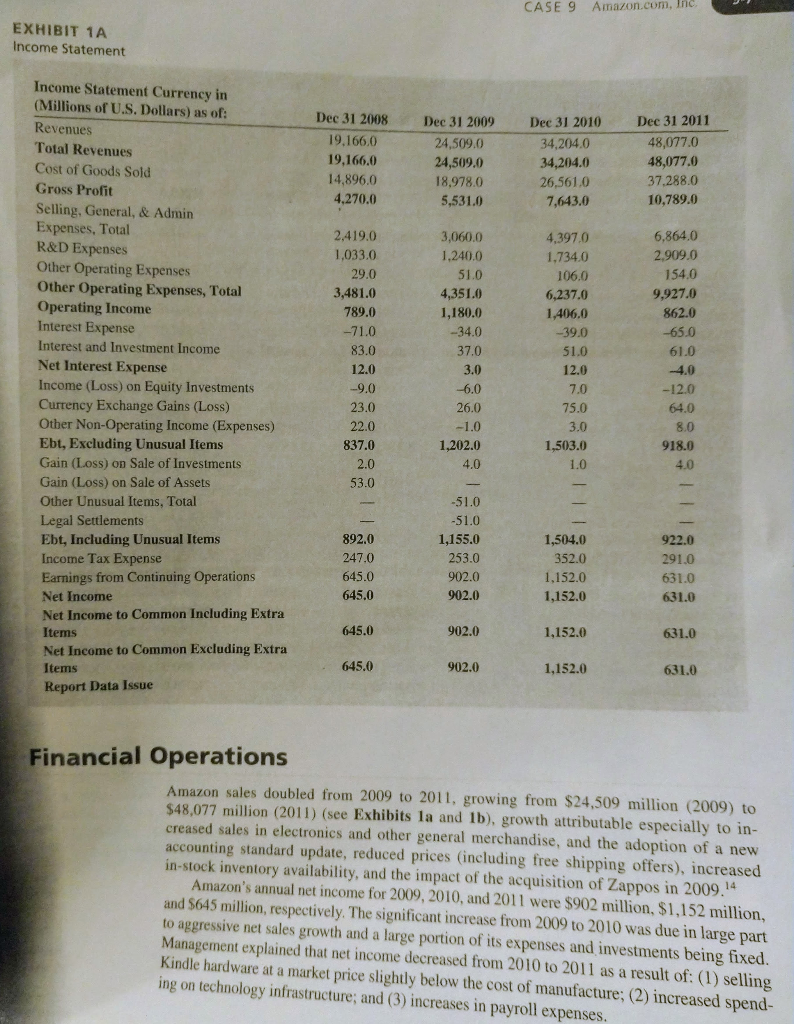
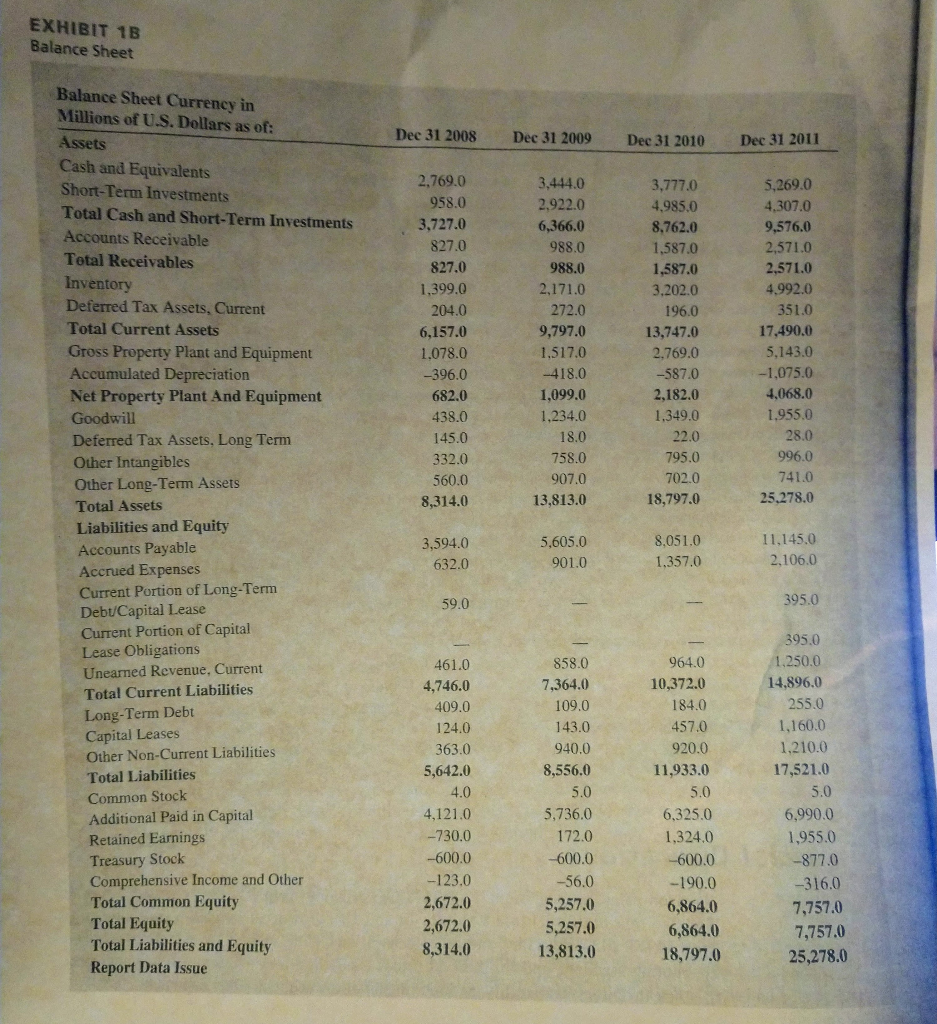
CASE 9 Amazon.com, Inc EXHIBIT 1A Income Statement Dec 31 2008 19.166,0 19,166.0 14,896.0 4,270.0 Dec 31 2009 24,509.0 24,509.0 18.978.0 5,531.0 Dec 31 2010 34,204.0 34,204.0 26,561.0 7,643.0 Dec 31 2011 48,077.0 48,077.0 37.288.0 10,789.0 6,864.0 2.909.0 154.0 9,927.0 862.0 -65.0 Income Statement Currency in (Millions of U.S. Dollars) as of: Revenues Total Revenues Cost of Goods Sold Gross Profit Selling, General, & Admin Expenses. Total R&D Expenses Other Operating Expenses Other Operating Expenses, Total Operating Income Interest Expense Interest and Investment Income Net Interest Expense Income (Loss) on Equity Investments Currency Exchange Gains (Loss) Other Non-Operating Income (Expenses) Ebt, Excluding Unusual Items Gain (Loss) on Sale of Investments Gain (Loss) on Sale of Assets Other Unusual Items, Total Legal Settlements Ebt, Including Unusual Items Income Tax Expense Earnings from Continuing Operations Net Income Net Income to Common Including Extra Items Net Income to Common Excluding Extra Items Report Data Issue 2.419.0 1,033.0 29.0 3,481.0 789.0 -71.0 83.0 12.0 -9.0 23.0 22.0 837.0 3,060.0 1,240.0 51.0 4,351.0 1,180.0 --34.0 37.0 3.0 -6.0 26.0 -1.0 1,202.0 4.0 4.397.0 1,734,0 106.0 6,237.0 1,406.0 -39.0 51.0 12.0 7.0 75.0 61.0 4.0 -12.0 64.0 8.0 918.0 4.0 3.0 1,503.0 1.0 2.0 53.0 922.0 892.0 247.0 645.0 645.0 -51.0 -51.0 1,155.0 253.0 902.0 902.0 1,504.0 352.0 1.152.0 1,152.0 291.0 631.0 631.0 645.0 902.0 1,152.0 631.0 645.0 902.0 1,152.0 631.0 Financial Operations Amazon sales doubled from 2009 to 2011, growing from $24.509 million (2009) to $48,077 million (2011) (see Exhibits la and lb), growth attributable especially to in- creased sales in electronics and other general merchandise, and the adoption of a new accounting standard update, reduced prices (including free shipping offers), increased in-stock inventory availability, and the impact of the acquisition of Zappos in 2009.14 Amazon's annual net income for 2009, 2010, and 2011 were $902 million, $1,152 million, and $645 million, respectively. The significant increase from 2009 to 2010 was due in large part to aggressive net sales growth and a large portion of its expenses and investments being fixed. Management explained that net income decreased from 2010 to 2011 as a result of: (1) selling Kindle hardware at a market price slightly below the cost of manufacture; (2) increased spend- ing on technology infrastructure; and (3) increases in payroll expenses. EXHIBIT 1B Balance Sheet Balance Sheet Currency in Millions of U.S. Dollars as of: Dec 31 2008 Dec 31 2009 Dec 31 2010 Dec 31 2011 2,769.0 958.0 3,727.0 827.0 827.0 1,399.0 204.0 6,157.0 1.078.0 -396.0 682.0 438.0 145.0 332.0 560.0 8,314.0 3,444.0 2,922.0 6,366.0 988.0 988.0 2,171.0 272.0 9,797.0 1.517.0 -418.0 1,099.0 1,234.0 18.0 758.0 907.0 13,813.0 3,777.0 4,985.0 8,762.0 1,587.0 1,587.0 3.202.0 196.0 13,747.0 2.769.0 -587.0 2,182.0 1.349.0 22.0 795.0 5,269.0 4.307.0 9,576.0 2,571.0 2,571.0 4.992.0 351.0 17,490.0 5,143.0 -1,075.0 4,068.0 1.955.0 28.0 996.0 741.0 25,278.0 702.0 18,797.0 Assets Cash and Equivalents Short-Term Investments Total Cash and Short-Term Investments Accounts Receivable Total Receivables Inventory Deferred Tax Assets, Current Total Current Assets Gross Property Plant and Equipment Accumulated Depreciation Net Property Plant And Equipment Goodwill Deferred Tax Assets. Long Term Other Intangibles Other Long-Term Assets Total Assets Liabilities and Equity Accounts Payable Accrued Expenses Current Portion of Long-Term Debt/Capital Lease Current Portion of Capital Lease Obligations Unearned Revenue, Current Total Current Liabilities Long-Term Debt Capital Leases Other Non-Current Liabilities Total Liabilities Common Stock Additional Paid in Capital Retained Earnings Treasury Stock Comprehensive Income and Other Total Common Equity Total Equity Total Liabilities and Equity Report Data Issue 3,594.0 632.0 5,605.0 901.0 8.051.0 1.357.0 11.145.0 2,106.0 59.0 395.0 461.0 964.0 10,372.0 184.0 457.0 920.0 11,933.0 5.0 4,746.0 409.0 124.0 363.0 5,642.0 4.0 4,121.0 -730.0 -600.0 -123.0 2,672.0 2,672.0 8,314.0 858.0 7,364.0 109.0 143.0 940.0 8,556.0 5.0 5,736.0 172.0 600.0 -56.0 5,257.0 5,257.0 13,813.0 395.0 1.250.0 14,896.0 255.0 1,160.0 1.210.0 17,521.0 5.0 6,990.0 1,955.0 -877.0 -316.0 7.757.0 7,757.0 25,278.0 6,325.0 1,324.0 -600.0 -190.0 6,864.0 6,864.0 18,797.0