

Answered step by step
Verified Expert Solution
Question
1 Approved Answer
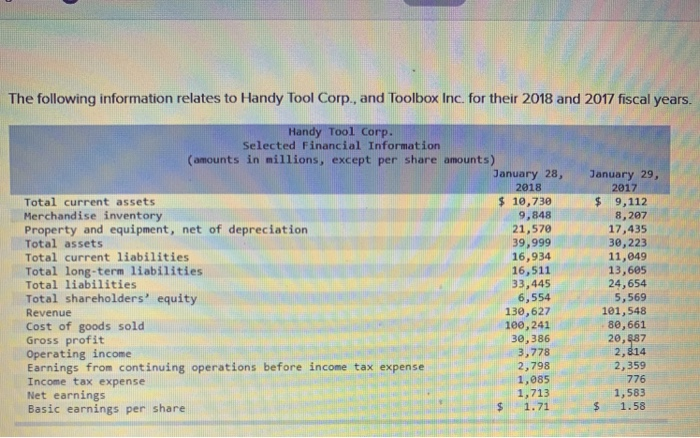
The following information relates to Handy Tool Corp., and Toolbox Inc. for their 2018 and 2017 fiscal years. January 29, 2017 $ 9,112 8,207 17,435
Step by Step Solution
There are 3 Steps involved in it
Step: 1

Get Instant Access to Expert-Tailored Solutions
See step-by-step solutions with expert insights and AI powered tools for academic success
Step: 2

Step: 3
Ace Your Homework with AI
Get the answers you need in no time with our AI-driven, step-by-step assistance
Get Started
Financial Accounting Tools For Business Decision Making WileyPLUS NextGen Card Single Semester
Authors: Paul D. Kimmel ,Jerry J. Weygandt ,Donald E. Kieso
10th Edition
1119791022, 978-1119791027