Answered step by step
Verified Expert Solution
Question
1 Approved Answer
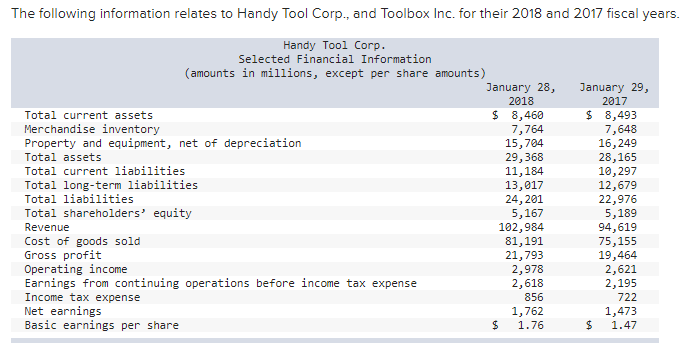
The following information relates to Handy Tool Corp., and Toolbox Inc. for their 2018 and 2017 fiscal years. Handy Tool Corp. Selected Financial Information


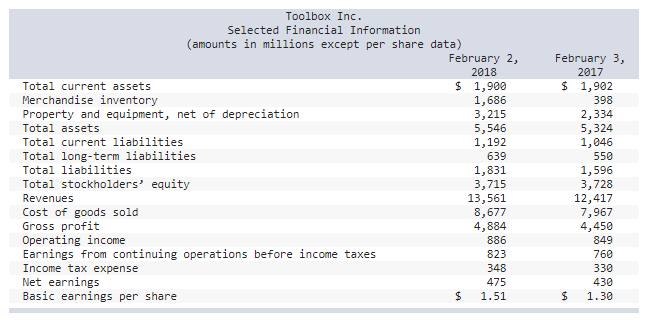
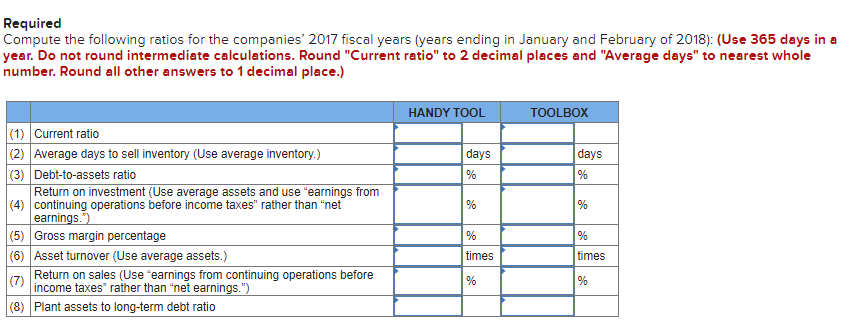
The following information relates to Handy Tool Corp., and Toolbox Inc. for their 2018 and 2017 fiscal years. Handy Tool Corp. Selected Financial Information (amounts in millions, except per share amounts) Total current assets Merchandise inventory Property and equipment, net of depreciation Total assets Total current liabilities Total long-term liabilities Total liabilities Total shareholders' equity Revenue Cost of goods sold Gross profit Operating income Earnings from continuing operations before income tax expense Income tax expense Net earnings Basic earnings per share January 28, 2018 $ 8,460 7,764 15,704 29,368 11,184 13,017 24, 201 5,167 102,984 81,191 21,793 2,978 2,618 856 $ 1,762 1.76 January 29, 2017 $ 8,493 7,648 16,249 $ 28,165 10,297 12,679 22,976 5,189 94,619 75,155 19,464 2,621 2,195 722 1,473 1.47 Total current assets Merchandise inventory Property and equipment, net of depreciation Total assets Total current liabilities Toolbox Inc. Selected Financial Information (amounts in millions except per share data) Total long-term liabilities Total liabilities Total stockholders' equity Revenues Cost of goods sold Gross profit Operating income Earnings from continuing operations before income taxes Income tax expense Net earnings Basic earnings per share February 2, 2018 $ 1,900 1,686 $ 3,215 5,546 1,192 639 1,831 3,715 13,561 8,677 4,884 886 823 348 475 1.51 February 3, 2017 $ 1,902 398 1A $ 2,334 5,324 1,046 550 1,596 3,728 12,417 7,967 4,450 849 760 330 430 1.30 Required Compute the following ratios for the companies' 2017 fiscal years (years ending in January and February of 2018): (Use 365 days in a year. Do not round intermediate calculations. Round "Current ratio" to 2 decimal places and "Average days" to nearest whole number. Round all other answers to 1 decimal place.) (1) Current ratio (2) Average days to sell inventory (Use average inventory.) (3) Debt-to-assets ratio Return on investment (Use average assets and use "earnings from (4) continuing operations before income taxes" rather than "net earnings.") (5) Gross margin percentage (6) Asset turnover (Use average assets.) (7) Return on sales (Use "earnings from continuing operations before income taxes" rather than "net earnings.") (8) Plant assets to long-term debt ratio HANDY TOOL days % % % times % TOOLBOX days % % % times %
Step by Step Solution
★★★★★
3.40 Rating (150 Votes )
There are 3 Steps involved in it
Step: 1
Current ratio Formula Current RatioCurrent liabilities Current assets Calculation Particulars Handy Tool Corp ToolBox Inc a Current Assets 8493 1902 b ...
Get Instant Access to Expert-Tailored Solutions
See step-by-step solutions with expert insights and AI powered tools for academic success
Step: 2

Step: 3

Ace Your Homework with AI
Get the answers you need in no time with our AI-driven, step-by-step assistance
Get Started


