Answered step by step
Verified Expert Solution
Question
1 Approved Answer
The following is a numerical and graphical summary of a set of data: Choose the best description of shape for this data. The shape of
The following is a numerical and graphical summary of a set of data: Choose the best description of shape for this data. The shape of this data is bimodal. The shape of this data is skewed right. The shape of this data is uniform. The shape of this data is roughly symmetrical.Answer and type up all questions, remembering to show your working. Write name and
ID on the front page. Hand in the pdf file of your assignment via the Blackboard, using
your name and ID number as file name.
For full marks, you must include a printout of the code and relevant plots in your
assignment.
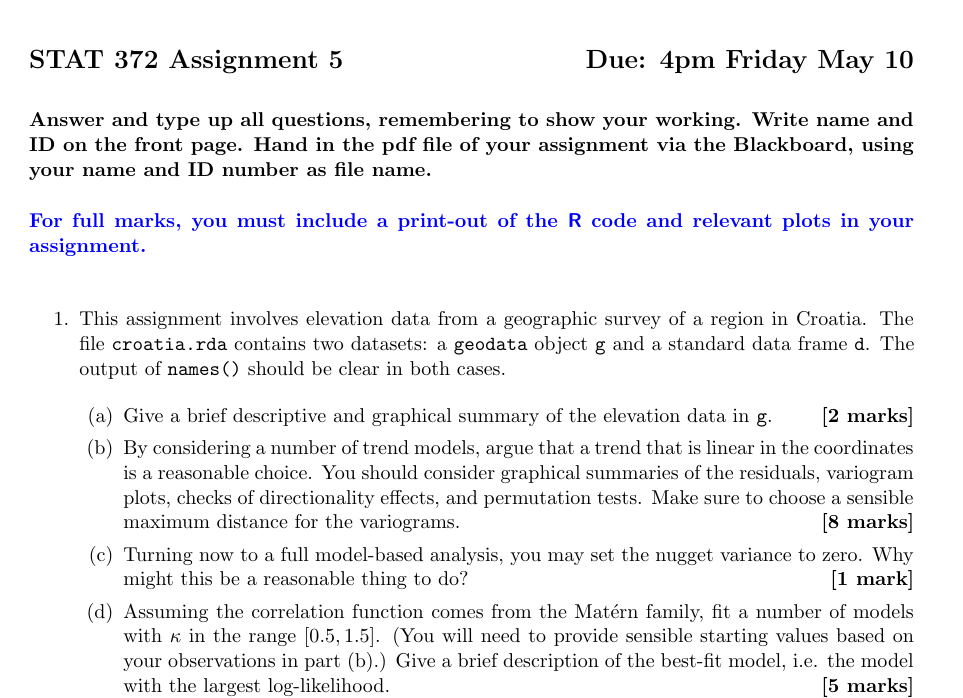
This assignment involves elevation data from a geographic survey of a region in Croatia. The
file croatia.rda contains two datasets: a geodata object and a standard data frame The
output of names should be clear in both cases.
a Give a brief descriptive and graphical summary of the elevation data in g marks
b By considering a number of trend models, argue that a trend that is linear in the coordinates
is a reasonable choice. You should consider graphical summaries of the residuals, variogram
plots, checks of directionality effects, and permutation tests. Make sure to choose a sensible
maximum distance for the variograms.
marks

Step by Step Solution
There are 3 Steps involved in it
Step: 1

Get Instant Access to Expert-Tailored Solutions
See step-by-step solutions with expert insights and AI powered tools for academic success
Step: 2

Step: 3

Ace Your Homework with AI
Get the answers you need in no time with our AI-driven, step-by-step assistance
Get Started


