

Question
The following is EI Optimismo's Balance Sheet and Income Statement for the last three fiscal years. Please evaluate the recent financial performance of the company
The following is EI Optimismo's Balance Sheet and Income Statement for the last three fiscal years. Please evaluate the recent financial performance of the company using the financial ratios you consider most relevant. Make your calculations using year-end Balance Sheet data (do not use, in any case where you could, the average of the Balance Sheet accounts). Additionally, do not limit yourself to financial ratios to evaluate the company, use any other indicator you consider relevant. If you find any reason/indicator that points to a problem, elaborate on the possible reasons that may have caused it. Finally, prepare a Statement of Changes in Financial Position for each of the periods 1997-1996 and 1996-1995. What additional information can be derived from this statement (if any)? Show the entire procedure performed and formulas used.
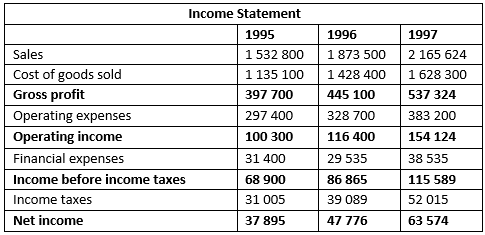
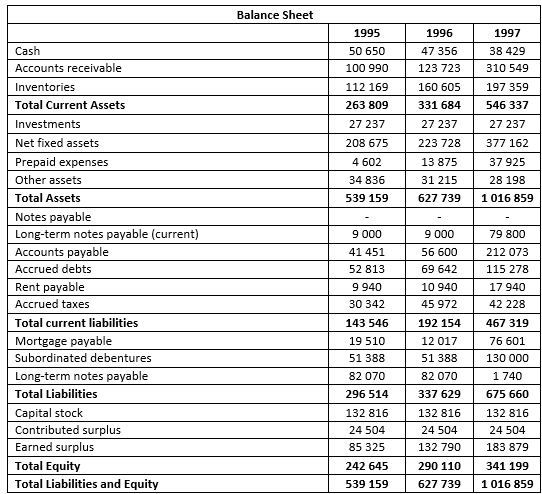
Income Statement 1995 Sales 1532 800 Cost of goods sold 1 135 100 Gross profit 397 700 Operating expenses 297 400 Operating income 100 300 Financial expenses 31 400 Income before income taxes 68 900 Income taxes 31 005 Net income 37 895 1996 1 873 500 1 428 400 445 100 328 700 116 400 29 535 86 865 39 089 47 776 1997 2 165 624 1 628 300 537 324 383 200 154 124 38 535 115 589 52 015 63 574 Balance Sheet 1995 50 650 100 990 112 169 1996 47 356 123 723 1997 38 429 310 549 160 605 331 684 263 809 27 237 208 675 197 359 546 337 27 237 377 162 4 602 27 237 223 728 13 875 31 215 627 739 37 925 34 836 539 159 28 198 1 016 859 Cash Accounts receivable Inventories Total Current Assets Investments Net fixed assets Prepaid expenses Other assets Total Assets Notes payable Long-term notes payable (current) Accounts payable Accrued debts Rent payable Accrued taxes Total current liabilities Mortgage payable Subordinated debentures Long-term notes payable Total Liabilities Capital stock Contributed surplus Earned surplus Total Equity Total Liabilities and Equity 9 000 41 451 52 813 9 940 30 342 9 000 56 600 69 642 10 940 45 972 79 800 212 073 115 278 17 940 42 228 143 546 467 319 19 510 51 388 82 070 296 514 192 154 12 017 51 388 82 070 337 629 132 816 24 504 132 790 290 110 627 739 76 601 130 000 1 740 675 660 132 816 24 504 183 879 132 816 24 504 85 325 242 645 539 159 341 199 1 016 859 Income Statement 1995 Sales 1532 800 Cost of goods sold 1 135 100 Gross profit 397 700 Operating expenses 297 400 Operating income 100 300 Financial expenses 31 400 Income before income taxes 68 900 Income taxes 31 005 Net income 37 895 1996 1 873 500 1 428 400 445 100 328 700 116 400 29 535 86 865 39 089 47 776 1997 2 165 624 1 628 300 537 324 383 200 154 124 38 535 115 589 52 015 63 574 Balance Sheet 1995 50 650 100 990 112 169 1996 47 356 123 723 1997 38 429 310 549 160 605 331 684 263 809 27 237 208 675 197 359 546 337 27 237 377 162 4 602 27 237 223 728 13 875 31 215 627 739 37 925 34 836 539 159 28 198 1 016 859 Cash Accounts receivable Inventories Total Current Assets Investments Net fixed assets Prepaid expenses Other assets Total Assets Notes payable Long-term notes payable (current) Accounts payable Accrued debts Rent payable Accrued taxes Total current liabilities Mortgage payable Subordinated debentures Long-term notes payable Total Liabilities Capital stock Contributed surplus Earned surplus Total Equity Total Liabilities and Equity 9 000 41 451 52 813 9 940 30 342 9 000 56 600 69 642 10 940 45 972 79 800 212 073 115 278 17 940 42 228 143 546 467 319 19 510 51 388 82 070 296 514 192 154 12 017 51 388 82 070 337 629 132 816 24 504 132 790 290 110 627 739 76 601 130 000 1 740 675 660 132 816 24 504 183 879 132 816 24 504 85 325 242 645 539 159 341 199 1 016 859
Step by Step Solution
There are 3 Steps involved in it
Step: 1

Get Instant Access to Expert-Tailored Solutions
See step-by-step solutions with expert insights and AI powered tools for academic success
Step: 2

Step: 3
Ace Your Homework with AI
Get the answers you need in no time with our AI-driven, step-by-step assistance
Get Started
Finance And Modernization
Authors: Gerald D. Feldman, Peter Hertner
1st Edition
0754662713, 978-0754662716