Answered step by step
Verified Expert Solution
Question
1 Approved Answer
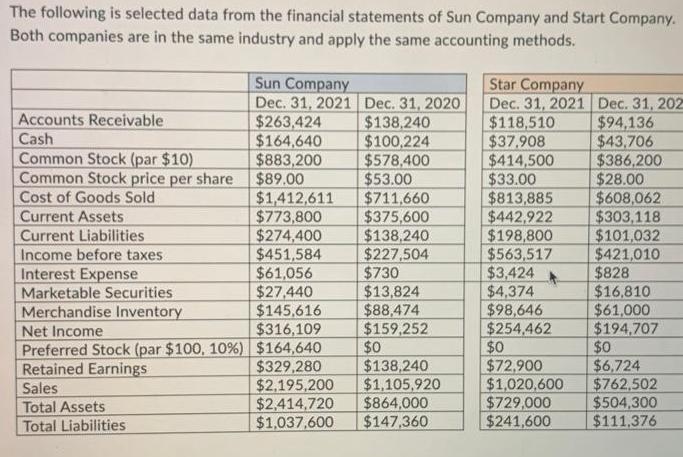
The following is selected data from the financial statements of Sun Company and Start Company. Both companies are in the same industry and apply


The following is selected data from the financial statements of Sun Company and Start Company. Both companies are in the same industry and apply the same accounting methods. Accounts Receivable Cash Common Stock (par $10) Common Stock price per share Cost of Goods Sold Current Assets Current Liabilities Income before taxes Interest Expense Marketable Securities Merchandise Inventory Net Income Sun Company Dec. 31, 2021 Dec. 31, 2020 Sales Total Assets Total Liabilities $263,424 $164,640 $883,200 $89.00 $1,412,611 $773,800 $274,400 $451,584 $61,056 $27,440 $145,616 $316,109 Preferred Stock (par $100, 10%) $164,640 Retained Earnings $329,280 $138,240 $100,224 $578,400 $53.00 $730 $13,824 $88,474 $159,252 $0 $138,240 $2,195,200 $1,105,920 $2,414,720 $864,000 $1,037,600 $147,360 $711,660 $375,600 $138,240 $227,504 Star Company Dec. 31, 2021 $118,510 $37,908 $414,500 $33.00 $813,885 $442,922 $198,800 $563,517 $3,424 $4,374 $98,646 $254,462 $0 $72.900 $1,020,600 $729,000 $241,600 Dec. 31, 202 $94,136 $43,706 $386,200 $28.00 $608,062 $303,118 $101,032 $421,010 $828 $16,810 $61,000 $194,707 $0 $6,724 $762,502 $504,300 $111,376
Step by Step Solution
★★★★★
3.48 Rating (161 Votes )
There are 3 Steps involved in it
Step: 1
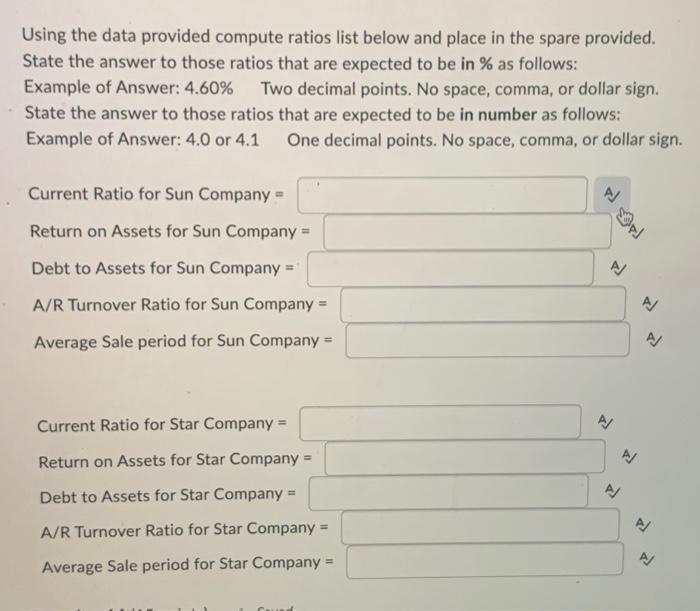
Using the provided data calculate the ratios for Sun Company and Star Company Current Ratio for Sun ...
Get Instant Access to Expert-Tailored Solutions
See step-by-step solutions with expert insights and AI powered tools for academic success
Step: 2

Step: 3

Ace Your Homework with AI
Get the answers you need in no time with our AI-driven, step-by-step assistance
Get Started


