

Answered step by step
Verified Expert Solution
Question
1 Approved Answer
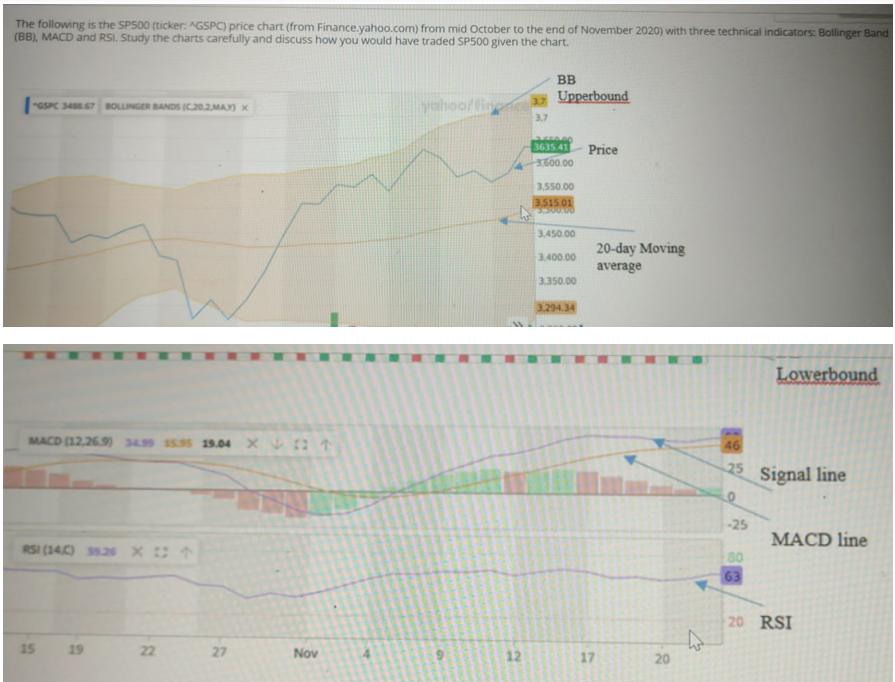
The following is the SP500 (ticker: GSPC) price chart (from Finance.yahoo.com) from mid October to the end of November 2020) with three technical indicators: Bollinger
Step by Step Solution
There are 3 Steps involved in it
Step: 1

Get Instant Access to Expert-Tailored Solutions
See step-by-step solutions with expert insights and AI powered tools for academic success
Step: 2

Step: 3
Ace Your Homework with AI
Get the answers you need in no time with our AI-driven, step-by-step assistance
Get Started
Entrepreneurial Finance Concepts And Cases
Authors: Miranda S. Lam, Gina Vega
1st Edition
1138013609, 978-1138013605