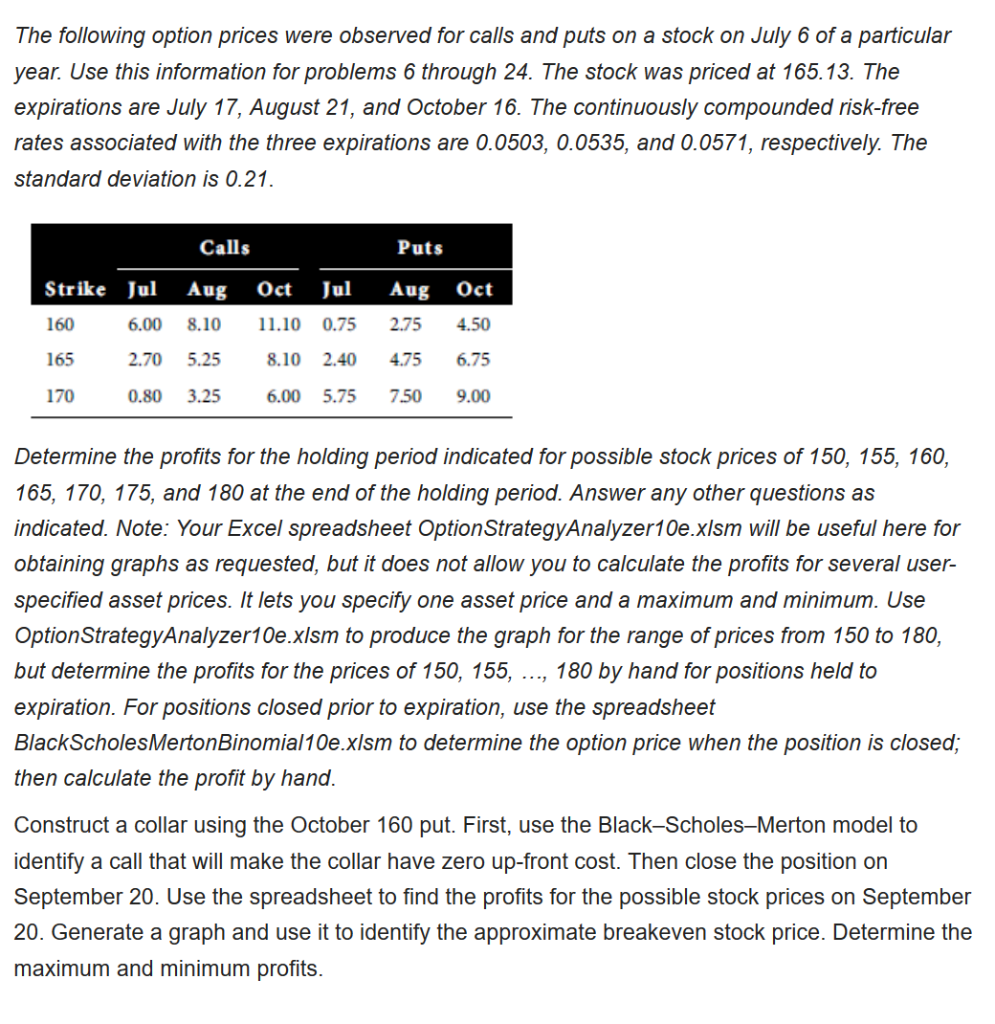
The following option prices were observed for calls and puts on a stock on July 6 of a particular year. Use this information for problems 6 through 24. The stock was priced at 165.13. The expirations are July 17, August 21, and October 16. The continuously compounded risk-free rates associated with the three expirations are 0.0503, 0.0535, and 0.0571, respectively. The standard deviation is 0.21. Calls Puts Strike Jul Aug Oct 160 6.00 8.10 11.10 165 2.70 5.25 8.10 170 0.80 3.25 6.00 Jul 0.75 2.40 5.75 Aug Oct 2.75 4.50 4.75 6.75 7.50 9.00 Determine the profits for the holding period indicated for possible stock prices of 150, 155, 160, 165, 170, 175, and 180 at the end of the holding period. Answer any other questions as indicated. Note: Your Excel spreadsheet Option StrategyAnalyzer10e.xlsm will be useful here for obtaining graphs as requested, but it does not allow you to calculate the profits for several user- specified asset prices. It lets you specify one asset price and a maximum and minimum. Use Option Strategy Analyzer10e.xlsm to produce the graph for the range of prices from 150 to 180, but determine the profits for the prices of 150, 155, ..., 180 by hand for positions held to expiration. For positions closed prior to expiration, use the spreadsheet BlackScholes Merton Binomial10e.xlsm to determine the option price when the position is closed; then calculate the profit by hand. Construct a collar using the October 160 put. First, use the Black-Scholes-Merton model to identify a call that will make the collar have zero up-front cost. Then close the position on September 20. Use the spreadsheet to find the profits for the possible stock prices on September 20. Generate a graph and use it to identify the approximate breakeven stock price. Determine the maximum and minimum profits. The following option prices were observed for calls and puts on a stock on July 6 of a particular year. Use this information for problems 6 through 24. The stock was priced at 165.13. The expirations are July 17, August 21, and October 16. The continuously compounded risk-free rates associated with the three expirations are 0.0503, 0.0535, and 0.0571, respectively. The standard deviation is 0.21. Calls Puts Strike Jul Aug Oct 160 6.00 8.10 11.10 165 2.70 5.25 8.10 170 0.80 3.25 6.00 Jul 0.75 2.40 5.75 Aug Oct 2.75 4.50 4.75 6.75 7.50 9.00 Determine the profits for the holding period indicated for possible stock prices of 150, 155, 160, 165, 170, 175, and 180 at the end of the holding period. Answer any other questions as indicated. Note: Your Excel spreadsheet Option StrategyAnalyzer10e.xlsm will be useful here for obtaining graphs as requested, but it does not allow you to calculate the profits for several user- specified asset prices. It lets you specify one asset price and a maximum and minimum. Use Option Strategy Analyzer10e.xlsm to produce the graph for the range of prices from 150 to 180, but determine the profits for the prices of 150, 155, ..., 180 by hand for positions held to expiration. For positions closed prior to expiration, use the spreadsheet BlackScholes Merton Binomial10e.xlsm to determine the option price when the position is closed; then calculate the profit by hand. Construct a collar using the October 160 put. First, use the Black-Scholes-Merton model to identify a call that will make the collar have zero up-front cost. Then close the position on September 20. Use the spreadsheet to find the profits for the possible stock prices on September 20. Generate a graph and use it to identify the approximate breakeven stock price. Determine the maximum and minimum profits