

Question
The following option prices were observed for calls and puts on a stock on July 6 of a particular year. Use this information for problems
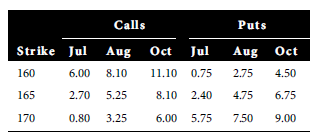
The following option prices were observed for calls and puts on a stock on July 6 of a particular year. Use this information for problems 6 through 24. The stock was priced at 165.13. The expirations are July 17, August 21, and October 16. The continuously compounded risk-free rates associated with the three expirations are 0.0503, 0.0535, and 0.0571, respectively. The standard deviation is 0.21.
Determine the profits for the holding period indicated for possible stock prices of 150, 155, 160, 165, 170, 175, and 180 at the end of the holding period. Answer any other questions as indicated. Note: Your Excel spreadsheet OptionStrategyAnalyzer10e.xlsm will be useful here for obtaining graphs as requested, but it does not allow you to calculate the profits for several user-specified asset prices. It lets you specify one asset price and a maximum and minimum. Use OptionStrategyAnalyzer10e.xlsm to produce the graph for the range of prices from 150 to 180, but determine the profits for the prices of 150, 155, , 180 by hand for positions held to expiration. For positions closed prior to expiration, use the spreadsheet BlackScholesMertonBinomial10e.xlsm to determine the option price when the position is closed; then calculate the profit by hand.
A strip is a variation of a straddle involving two puts and one call. Construct a short strip using the August 170 options. Hold the position until the options expire. Determine the profits and graph the results. Identify the breakeven stock prices at expiration and the minimum profit.
\begin{tabular}{llllllll} & \multicolumn{3}{c}{ Calls } & & \multicolumn{3}{c}{ Puts } \\ \cline { 2 - 4 } \cline { 6 - 8 } Strike & Jul & Aug & Oct & & Jul & Aug & Oct \\ \hline 160 & 6.00 & 8.10 & 11.10 & 0.75 & 2.75 & 4.50 \\ 165 & 2.70 & 5.25 & 8.10 & 2.40 & 4.75 & 6.75 \\ 170 & 0.80 & 3.25 & 6.00 & 5.75 & 7.50 & 9.00 \\ \hline \end{tabular}Step by Step Solution
There are 3 Steps involved in it
Step: 1

Get Instant Access to Expert-Tailored Solutions
See step-by-step solutions with expert insights and AI powered tools for academic success
Step: 2

Step: 3
Ace Your Homework with AI
Get the answers you need in no time with our AI-driven, step-by-step assistance
Get Started
The New International Financial System Analyzing The Cumulative Impact Of Regulatory Reform
Authors: Douglas Evanoff , Douglas D Evanoff , Andrew G Haldane , George G Kaufman
1st Edition
9814678325,9814678341