

Answered step by step
Verified Expert Solution
Question
1 Approved Answer
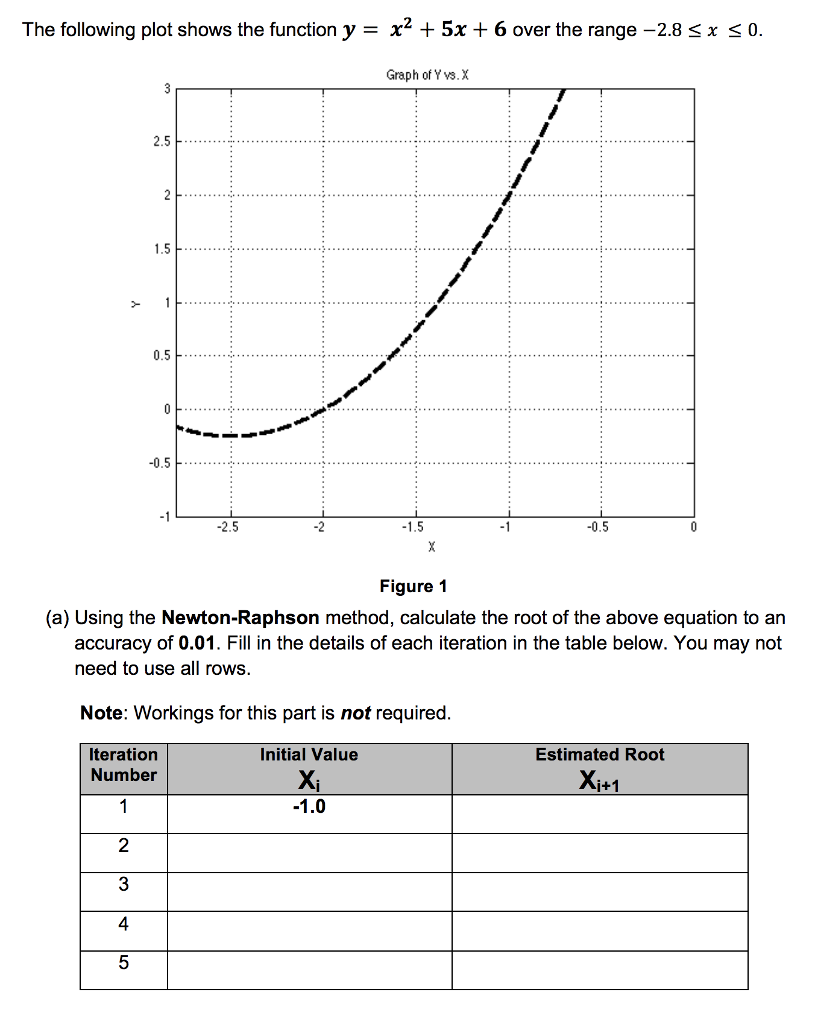
The following plot shows the function x2 + 5x + 6 over the range-2.8 0 x Graph of Y vs. X 2.5 0.5 0.5 2.5
Step by Step Solution
There are 3 Steps involved in it
Step: 1

Get Instant Access to Expert-Tailored Solutions
See step-by-step solutions with expert insights and AI powered tools for academic success
Step: 2

Step: 3
Ace Your Homework with AI
Get the answers you need in no time with our AI-driven, step-by-step assistance
Get Started
Databases In Networked Information Systems Second International Workshop Dnis 2002 Aizu Japan December 18 2002 Proceeding Lncs 2544
Authors: Subash Bhalla
1st Edition
3540002642, 978-3540002642