Answered step by step
Verified Expert Solution
Question
1 Approved Answer
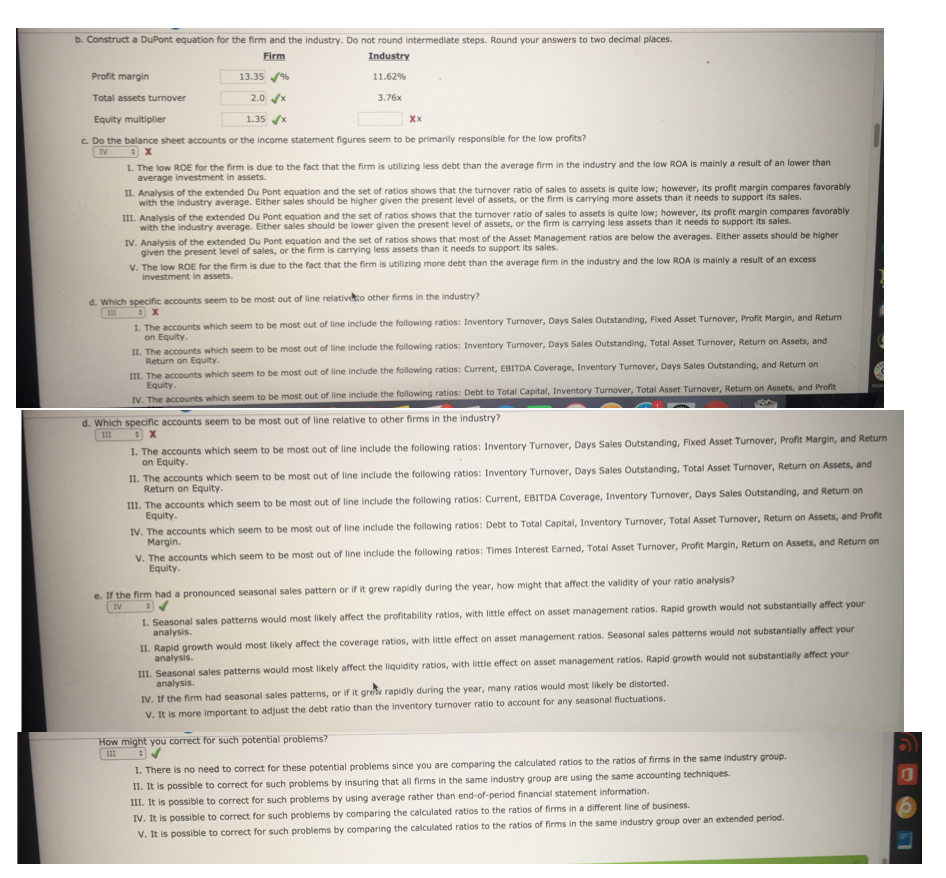
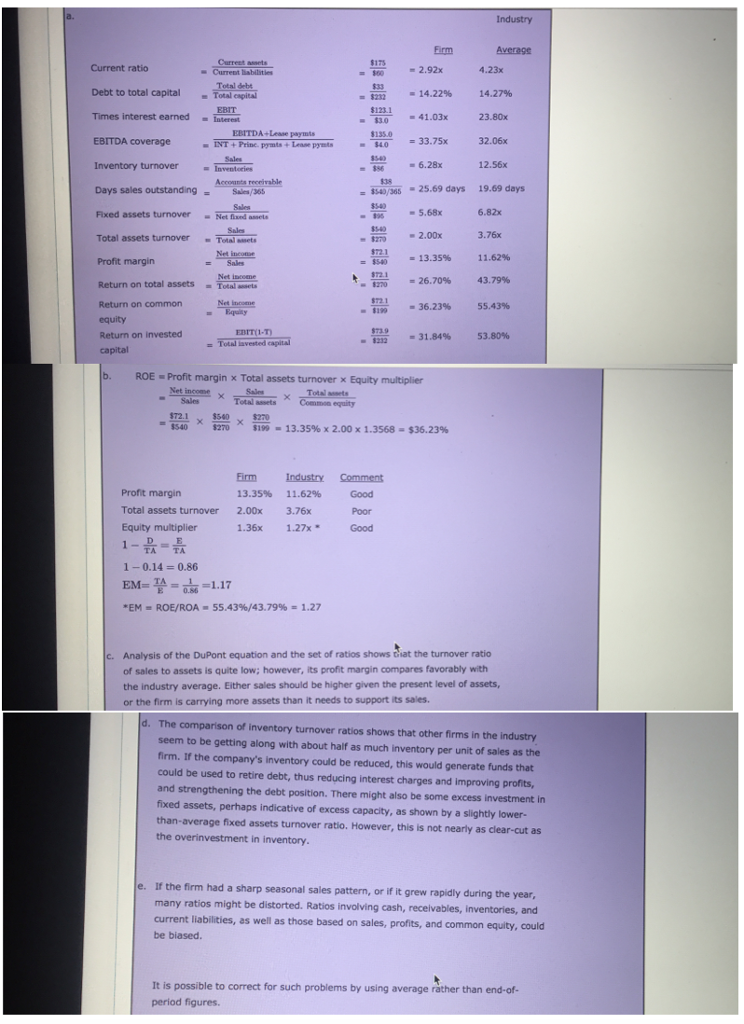
the following question is with my response and according to the assigment also the correct answers. I am having trouble on how to calculate the
the following question is with my response and according to the assigment also the correct answers. I am having trouble on how to calculate the correct answers for the onws that I got incorrect. if you could please explain thank you.
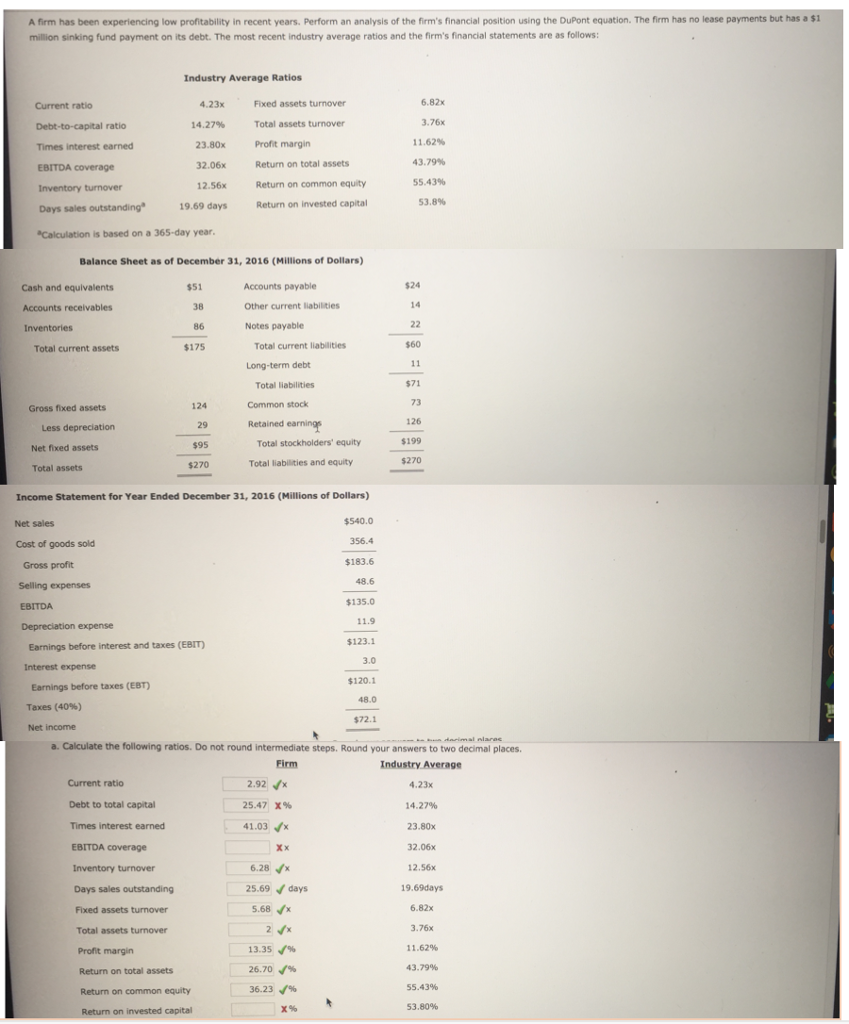
A firm has been experiencing low profitability in recent years. Perform an analysis of the firm's financial position using the DuPont equation. The firm has no lease payments but has a $1 million sinking fund payment on its debt. The most recent industry average ratios and the firm's financial statements are as follows Industry Average Ratios Current ratio Debt-to-capital ratio Times interest earned EBITDA coverage Inventory turnover Days sales outstanding1 Calculation is based on a 365-day year 6.82x 3.76x 11.62% 43.79% 55.43% 53.8% 4.23x 14.27% 23.80x Fixed assets turnover Total assets turnover Profit margin 32.06xReturn on total assets 12.56x Return on common equity 9.69 days Return on invested capital Balance Sheet as of December 31, 2016 (Millions of Dollars) $24 Cash and equivalents Accounts receivables Inventories $51 38 86 $175 Accounts payable Other current liabilities Notes payable 14 Total current assets Total current I $60 Long-term debt Total liabilities Common stock Retained earning $71 73 126 $199 $270 Gross fixed assets 29 $95 $270 Total stockholders' equity Net fixed assets Total liabilities and equity Total assets Income Statement for Year Ended December 31, 2016 (Millions of Dollars) $540.0 356.4 $183.6 Net sales Cost of goods sold Gross profit Selling expenses EBITDA Depreciation expense $135.0 $123.1 3.0 $120.1 Earnings before interest and taxes (EBIT) Interest expense Earnings before taxes (EST Taxes (40%) Net income $72.1 a. Calculate the following ratios. Do not round intermediate steps. Round your answers to two decimal places Firm Industry Average 4.23x 14.27% 23.80x 32.06x 12.56x 19.69days 6.82x 3.76x 11.62% 43.79% 55.43% 53.80% Current ratio 2.92x 25.47 x% 41.03x Debt to total capital Times interest earned EBITDA coverage Inventory turnover Days sales outstanding Fixed assets turnover Total assets 6.28x 25.69days 5.68x turnover 13.35% 26.70-% 36.23-% Profit margin Return on total assets Return on common equity Return on invested capitalStep by Step Solution
There are 3 Steps involved in it
Step: 1
Get Instant Access to Expert-Tailored Solutions
See step-by-step solutions with expert insights and AI powered tools for academic success
Step: 2
Step: 3
Ace Your Homework with AI
Get the answers you need in no time with our AI-driven, step-by-step assistance
Get Started