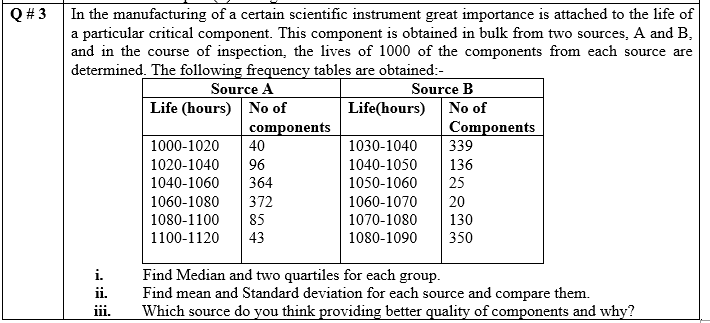
Question
The following scores represent the final examination grade for an elementary statistics course:- 2360793257745270823680778195416592855576521064 757825809881674171 83546472886274436078897684488490157934671782697463808561 i. Find its mean, median, mode , Quartiles and
The following scores represent the final examination grade for an elementary statistics course:-
2360793257745270823680778195416592855576521064 757825809881674171 83546472886274436078897684488490157934671782697463808561
i.Find its mean, median, mode , Quartiles and standard deviation
ii.Make a grouped frequency distribution of this data and again calculate mean, median, mode, Quartiles and standard deviation
iii.Compare your results of part(i) and part (ii), also comment on your results.
iv.Find mean, median, mode and standard deviation through R.
v.Define the skewness of this data set.
A study of the effect of smoking on sleep patterns is conducted. The measure observed is the time, in minutes, that it takes to fall asleep. These data are obtained:
Smokers: 69.356.022.147.653.248.152.734.4 60.243.823.213.8
Non Smokers: 28.625.126.434.928.828.438.530.230.631.841.621.136.037.913.9
i.By calculating mean for each data, which group do you think have better asleep time taken and why?
ii.Calculate standard deviation, variance and Co-efficient of variation for each group and compare them.
iii.Which group having greater value ofrelative dispersion and why?
iv.Solve part (ii) through R also.

Step by Step Solution
There are 3 Steps involved in it
Step: 1

Get Instant Access to Expert-Tailored Solutions
See step-by-step solutions with expert insights and AI powered tools for academic success
Step: 2

Step: 3

Ace Your Homework with AI
Get the answers you need in no time with our AI-driven, step-by-step assistance
Get Started


