Question
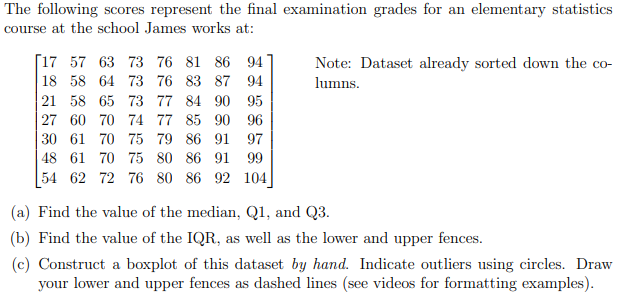
The following scores represent the final examination grades for an elementary statistics course at the school James works at: [17 57 63 73 76

The following scores represent the final examination grades for an elementary statistics course at the school James works at: [17 57 63 73 76 81 86 94 18 58 64 73 76 83 87 94 21 58 65 73 77 84 90 95 27 60 70 74 Note: Dataset already sorted down the co- lumns. 77 85 90 96 30 61 70 75 79 86 91 97 48 61 70 75 80 86 91 99 54 62 72 76 80 86 92 104 (a) Find the value of the median, Q1, and Q3. (b) Find the value of the IQR, as well as the lower and upper fences. (c) Construct a boxplot of this dataset by hand. Indicate outliers using circles. Draw your lower and upper fences as dashed lines (see videos for formatting examples).
Step by Step Solution
There are 3 Steps involved in it
Step: 1

Get Instant Access to Expert-Tailored Solutions
See step-by-step solutions with expert insights and AI powered tools for academic success
Step: 2

Step: 3

Ace Your Homework with AI
Get the answers you need in no time with our AI-driven, step-by-step assistance
Get StartedRecommended Textbook for
Essentials Of Probability And Statistics For Engineers And Scientists
Authors: Ronald E. Walpole, Raymond Myers, Sharon L. Myers, Keying E. Ye
1st Edition
0321783735, 978-0321783738
Students also viewed these Mechanical Engineering questions
Question
Answered: 1 week ago
Question
Answered: 1 week ago
Question
Answered: 1 week ago
Question
Answered: 1 week ago
Question
Answered: 1 week ago
Question
Answered: 1 week ago
Question
Answered: 1 week ago
Question
Answered: 1 week ago
Question
Answered: 1 week ago
Question
Answered: 1 week ago
Question
Answered: 1 week ago
Question
Answered: 1 week ago
Question
Answered: 1 week ago
Question
Answered: 1 week ago
Question
Answered: 1 week ago
Question
Answered: 1 week ago
Question
Answered: 1 week ago
Question
Answered: 1 week ago
Question
Answered: 1 week ago
Question
Answered: 1 week ago
Question
Answered: 1 week ago
View Answer in SolutionInn App


