Answered step by step
Verified Expert Solution
Link Copied!

Question

1 Approved Answer

The following selected data were taken from the financial statements of Robinson Inc. respective industry segment. Interpret the differences in the ratio in terms of
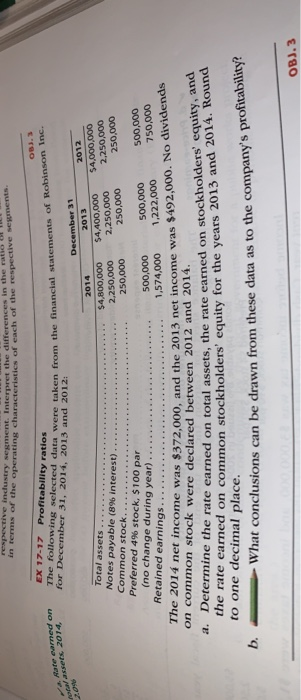
image text in transcribed
The following selected data were taken from the financial statements of Robinson Inc. respective industry segment. Interpret the differences in the ratio in terms of the operating characteristics of each of the respective segments. OB). Nute ned on Wasse 2014, EX 17-17 Profitability ratios for December 31, 2014, 2013 and 2012: 2014 $4,800,000 2,250,000 250,000 December 31 2013 54,400,000 2,250,000 250,000 2012 $4,000,000 2,250,000 250,000 Total assets Notes payable (8% interest). Common stock. Preferred 496 stock, $ 100 par (no change during year)...... Retained earnings .... 500,000 1,574,000 500,000 1,222,000 500,000 750,000 The 2014 net income was $372,000, and the 2013 net income was $492,000. No dividends on common stock were declared between 2012 and 2014. a. Determine the rate earned on total assets, the rate earned on stockholders' equity, and the rate earned on common stockholders' equity for the years 2013 and 2014. Round to one decimal place. b. What conclusions can be drawn from these data as to the company's profitability? OBJ.3

Step by Step Solution

There are 3 Steps involved in it

Step: 1

blur-text-image

Get Instant Access to Expert-Tailored Solutions

See step-by-step solutions with expert insights and AI powered tools for academic success

Step: 2

blur-text-image

Step: 3

blur-text-image

Ace Your Homework with AI

Get the answers you need in no time with our AI-driven, step-by-step assistance

Get Started

Students also viewed these Accounting questions

Question

Explain the benefits for special needs trusts.

Answered: 1 week ago

Question

What advice would you provide to Jennifer?

Answered: 1 week ago

Question

What are the issues of concern for each of the affected parties?

Answered: 1 week ago