Answered step by step
Verified Expert Solution
Question
1 Approved Answer
The following selected information is available for Nutco Inc. for three fiscal years: 2020 2019 2018 Current assets Current liabilities Net sales Cost of goods
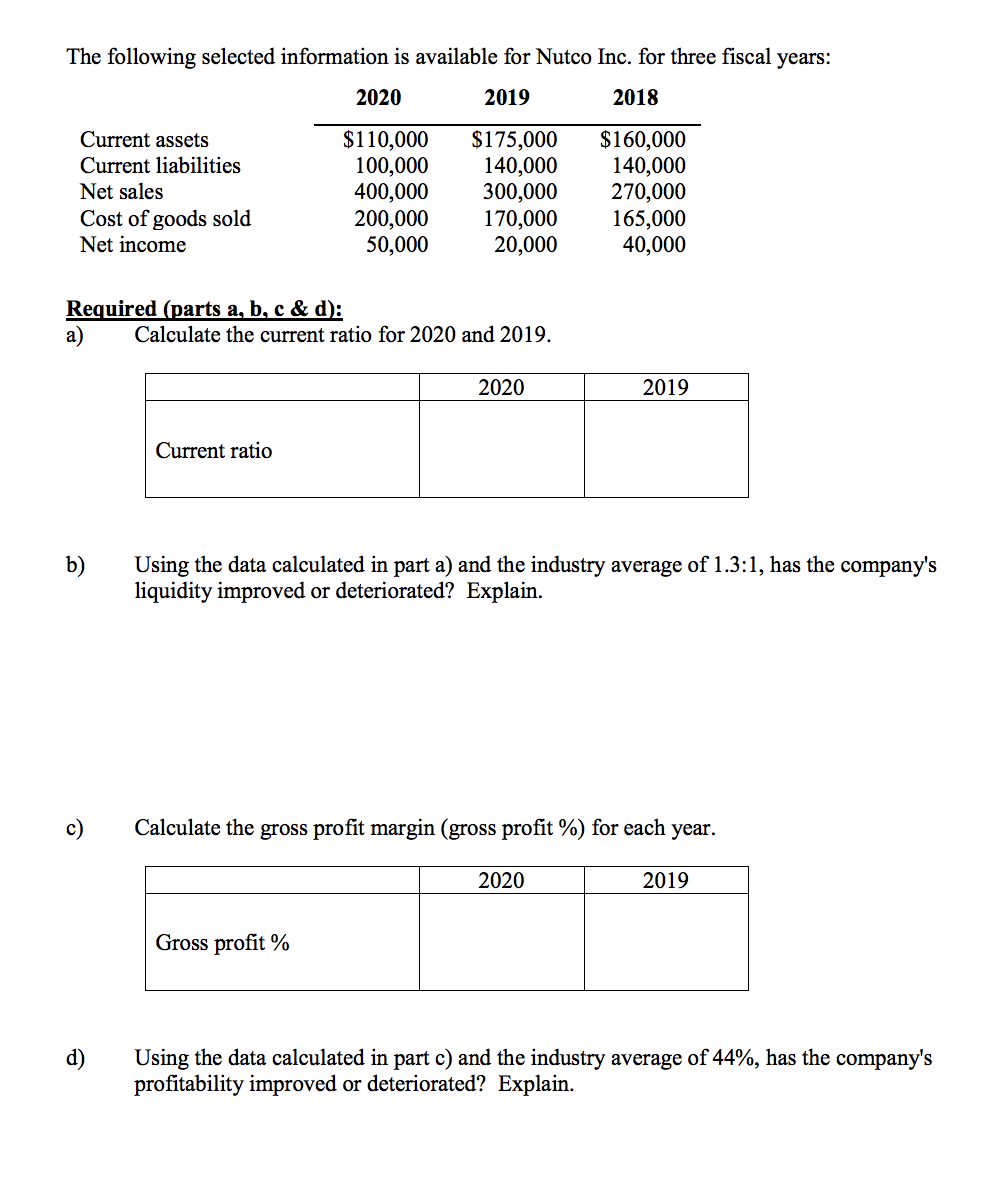
The following selected information is available for Nutco Inc. for three fiscal years: 2020 2019 2018 Current assets Current liabilities Net sales Cost of goods sold Net income $110,000 100,000 400,000 200,000 50,000 $175,000 140,000 300,000 170,000 20,000 $160,000 140,000 270,000 165,000 40,000 Required (parts a, b, c & d): a) Calculate the current ratio for 2020 and 2019. 2020 2019 Current ratio b) Using the data calculated in part a) and the industry average of 1.3:1, has the company's liquidity improved or deteriorated? Explain. c) Calculate the gross profit margin (gross profit %) for each year. 2020 2019 Gross profit % Using the data calculated in part c) and the industry average of 44%, has the company's profitability improved or deteriorated? Explain
Step by Step Solution
There are 3 Steps involved in it
Step: 1
Get Instant Access to Expert-Tailored Solutions
See step-by-step solutions with expert insights and AI powered tools for academic success
Step: 2
Step: 3
Ace Your Homework with AI
Get the answers you need in no time with our AI-driven, step-by-step assistance
Get Started