Answered step by step
Verified Expert Solution
Question
1 Approved Answer
The following shows Spandust Industries Inc.'s income statement for the last two years. The company had assets of $4,700 million in the first year and
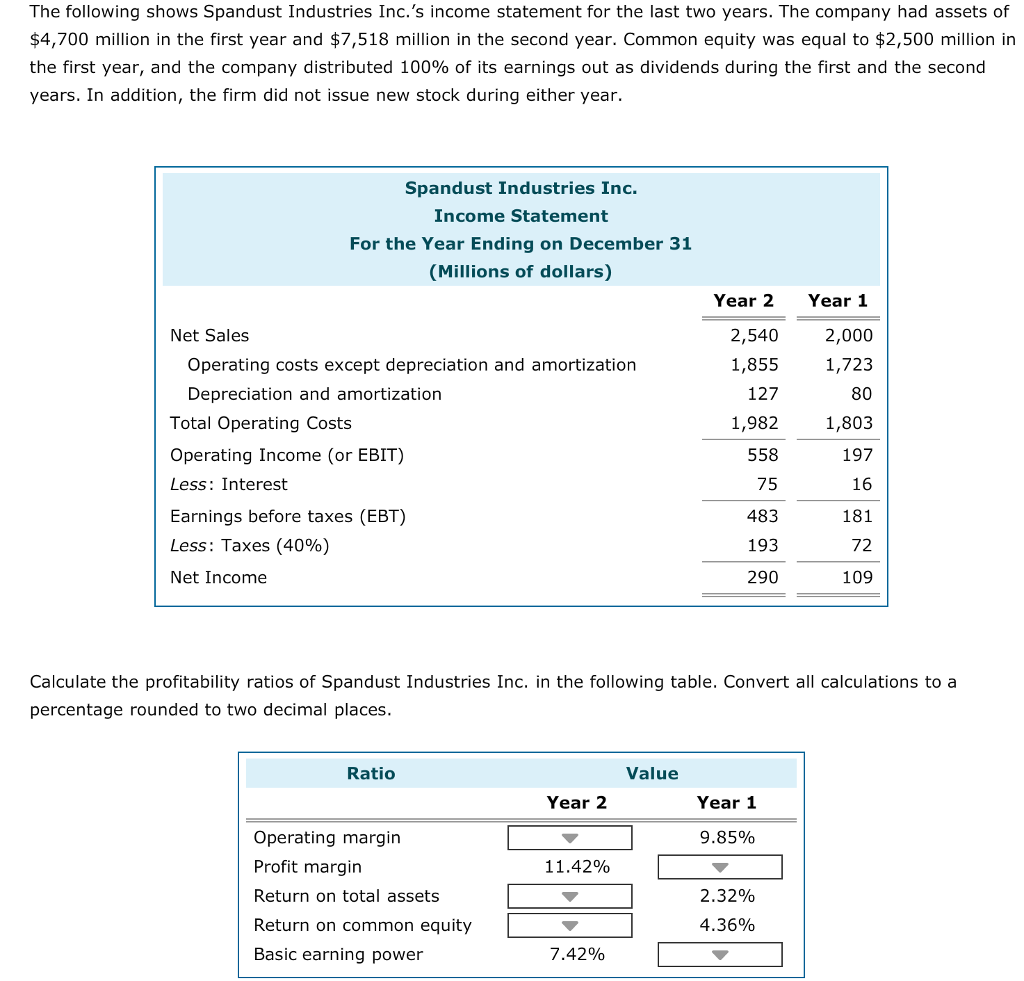
The following shows Spandust Industries Inc.'s income statement for the last two years. The company had assets of $4,700 million in the first year and $7,518 million in the second year. Common equity was equal to $2,500 million in the first year, and the company distributed 100% of its earnings out as dividends during the first and the second years. In addition, the firm did not issue new stock during either year. Spandust Industries Inc. Income Statement For the Year Ending on December 31 Millions of dollars) Year 2 2,540 1,855 127 1,982 558 75 483 193 290 Year 1 2,000 1,723 80 1,803 197 16 181 72 109 Net Sales Operating costs except depreciation and amortization Depreciation and amortization Total Operating Costs Operating Income (or EBIT) Less: Interest Earnings before taxes (EBT) Less: Taxes (40%) Net Income Calculate the profitability ratios of Spandust Industries Inc. in the following table. Convert all calculations to a percentage rounded to two decimal places Ratio Value Year 2 Year 1 9.85% Operating margin Profit margin Return on total assets Return on common equity Basic earning power 11.42% 2.32% 4.36%
Step by Step Solution
There are 3 Steps involved in it
Step: 1
Get Instant Access to Expert-Tailored Solutions
See step-by-step solutions with expert insights and AI powered tools for academic success
Step: 2
Step: 3
Ace Your Homework with AI
Get the answers you need in no time with our AI-driven, step-by-step assistance
Get Started