Answered step by step
Verified Expert Solution
Question
1 Approved Answer
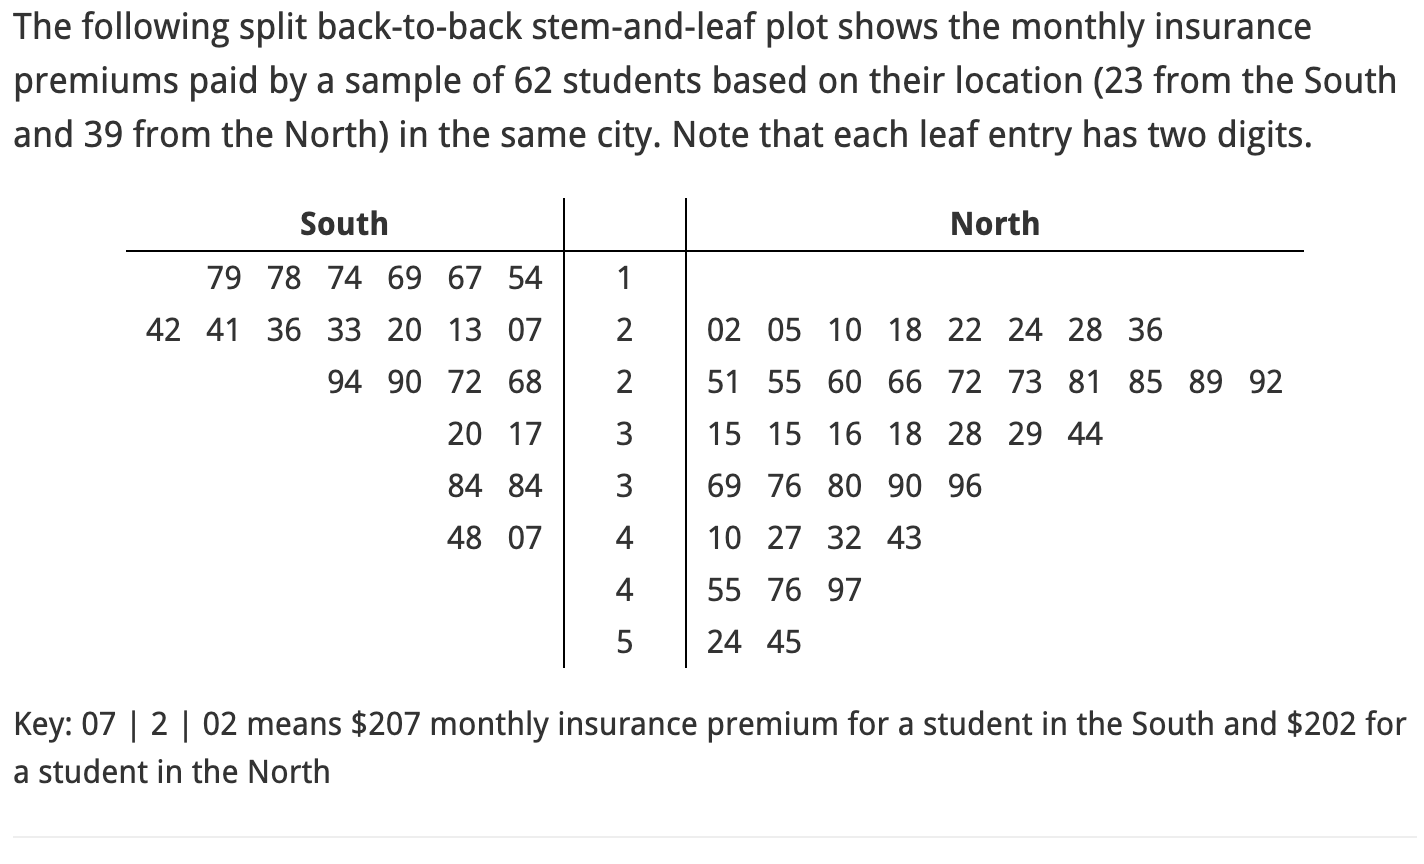
The following split back-to-back stem-and-leaf plot shows the monthly insurance premiums paid by a sample of 62 students based on their location (23 from


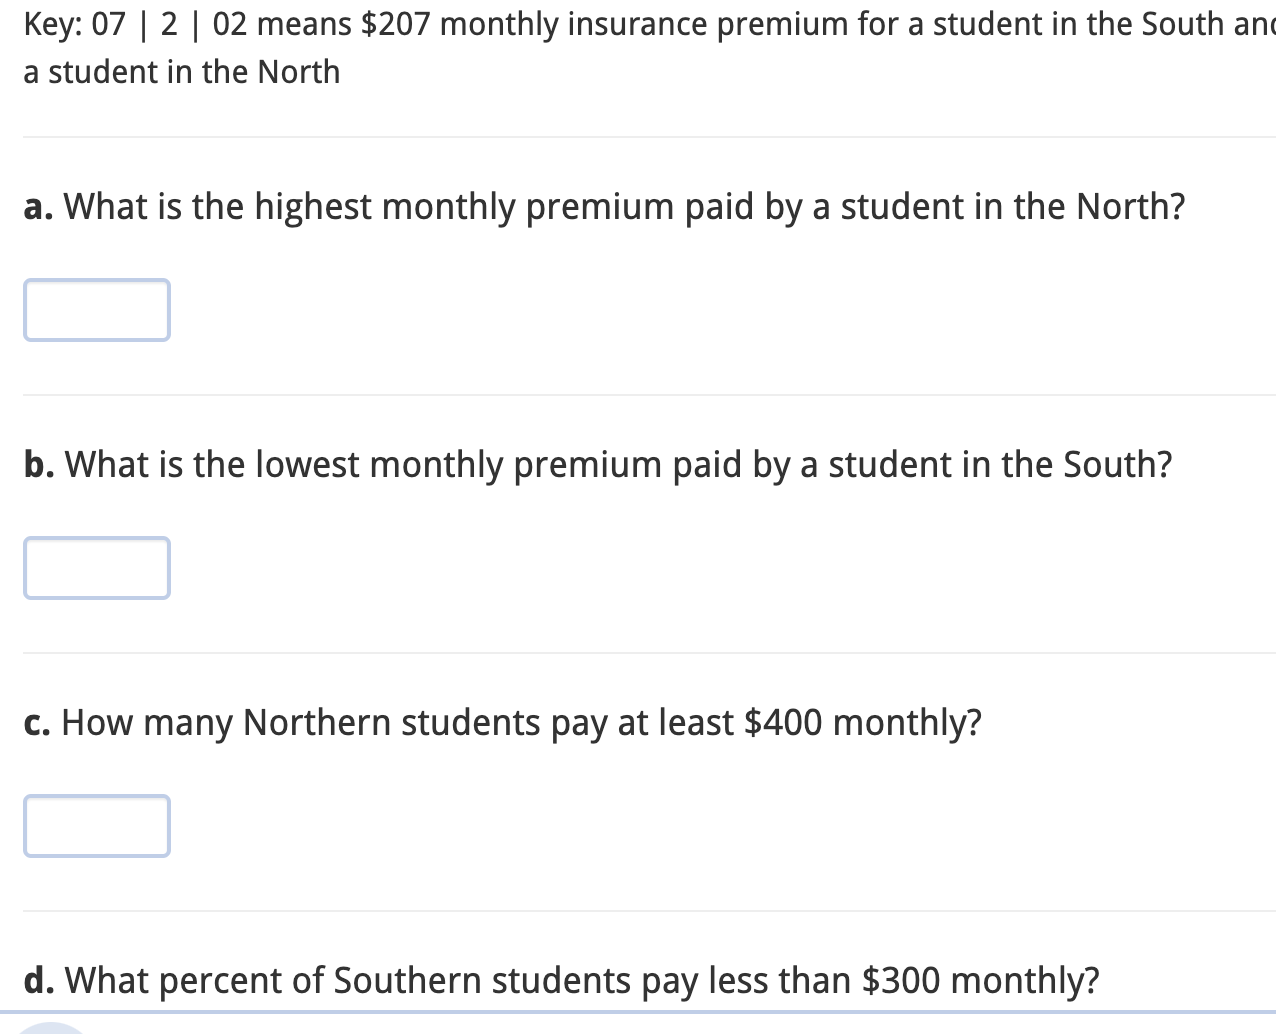
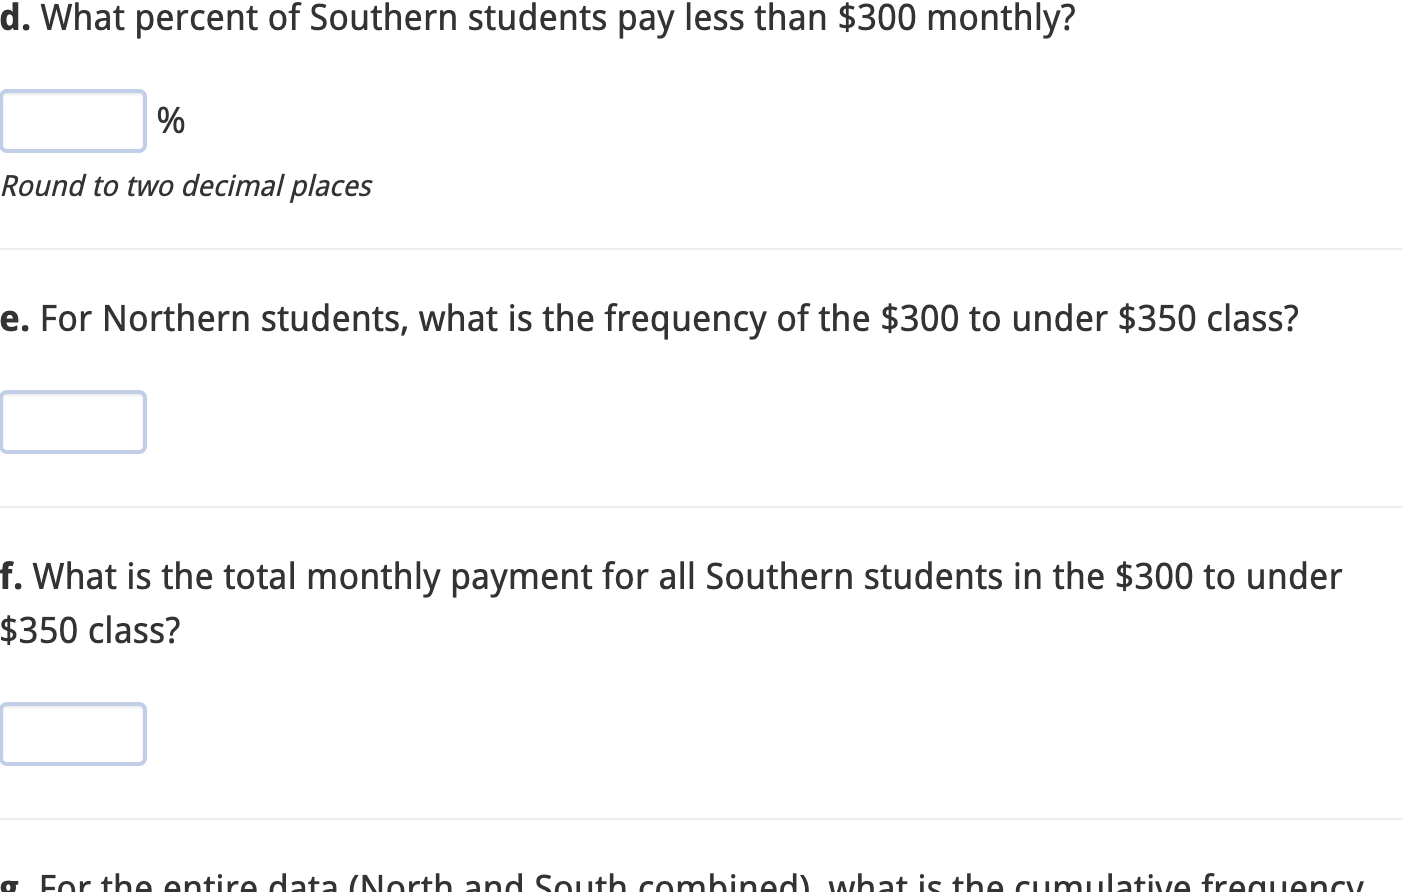
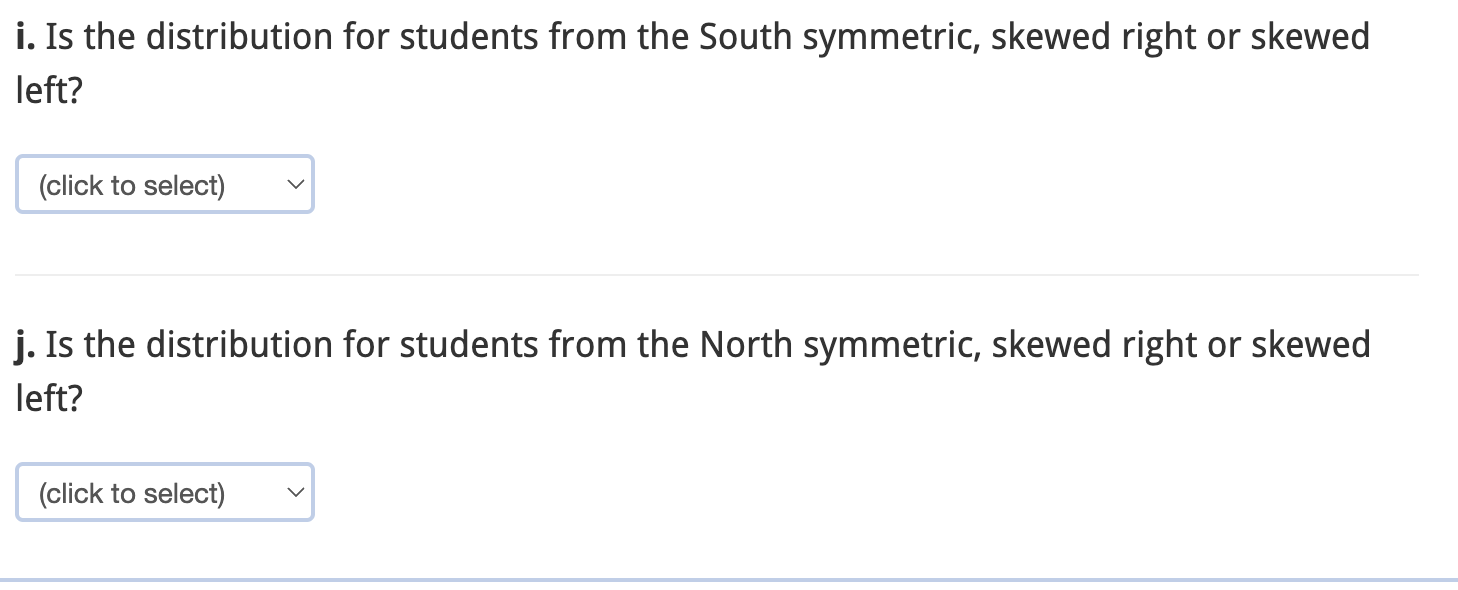
The following split back-to-back stem-and-leaf plot shows the monthly insurance premiums paid by a sample of 62 students based on their location (23 from the South and 39 from the North) in the same city. Note that each leaf entry has two digits. South 79 78 74 69 67 54 North 1 42 41 36 33 20 13 07 2 02 05 10 18 22 24 28 36 94 90 72 68 2 51 55 60 66 72 73 81 85 89 92 20 17 3 15 15 16 18 28 29 44 84 84 3 69 76 80 90 96 48 07 4 10 27 32 43 55 76 97 5 24 45 Key: 07 | 2 | 02 means $207 monthly insurance premium for a student in the South and $202 for a student in the North Key: 07 | 2 | 02 means $207 monthly insurance premium for a student in the South and a student in the North a. What is the highest monthly premium paid by a student in the North? b. What is the lowest monthly premium paid by a student in the South? c. How many Northern students pay at least $400 monthly? d. What percent of Southern students pay less than $300 monthly? d. What percent of Southern students pay less than $300 monthly? % Round to two decimal places e. For Northern students, what is the frequency of the $300 to under $350 class? f. What is the total monthly payment for all Southern students in the $300 to under $350 class? For the entire data (North and South combined) what is the cumulative frequency i. Is the distribution for students from the South symmetric, skewed right or skewed left? (click to select) j. Is the distribution for students from the North symmetric, skewed right or skewed left? (click to select)
Step by Step Solution
There are 3 Steps involved in it
Step: 1

Get Instant Access to Expert-Tailored Solutions
See step-by-step solutions with expert insights and AI powered tools for academic success
Step: 2

Step: 3

Ace Your Homework with AI
Get the answers you need in no time with our AI-driven, step-by-step assistance
Get Started


