

Answered step by step
Verified Expert Solution
Question
1 Approved Answer
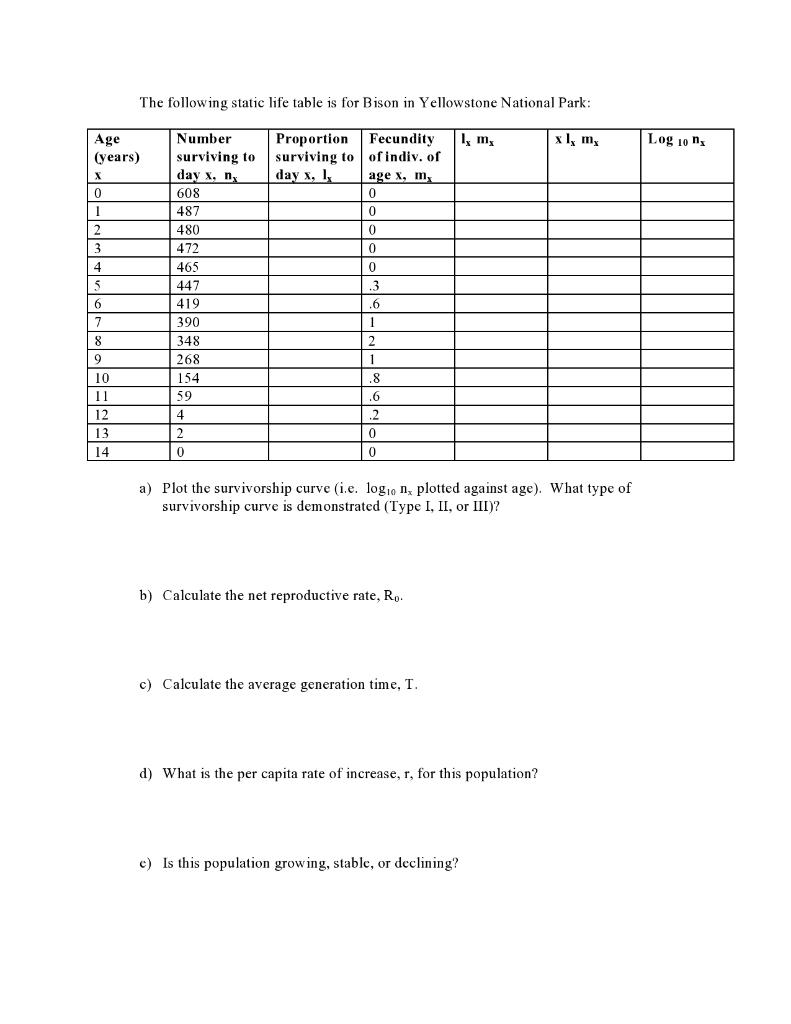
The following static life table is for Bison in Yellowstone National Park: 1 mg Log 10 ng Age (years) X 0 1 2 3 Proportion
Step by Step Solution
There are 3 Steps involved in it
Step: 1

Get Instant Access to Expert-Tailored Solutions
See step-by-step solutions with expert insights and AI powered tools for academic success
Step: 2

Step: 3
Ace Your Homework with AI
Get the answers you need in no time with our AI-driven, step-by-step assistance
Get Started
Compliance Audits And Plans For Healthcare
Authors: Cherilyn G. Murer, Michael A. Murer, Lyndean Lenhoff Brick, Healthcare Financial Management Association (U. S.)
1st Edition