

Answered step by step
Verified Expert Solution
Question
1 Approved Answer
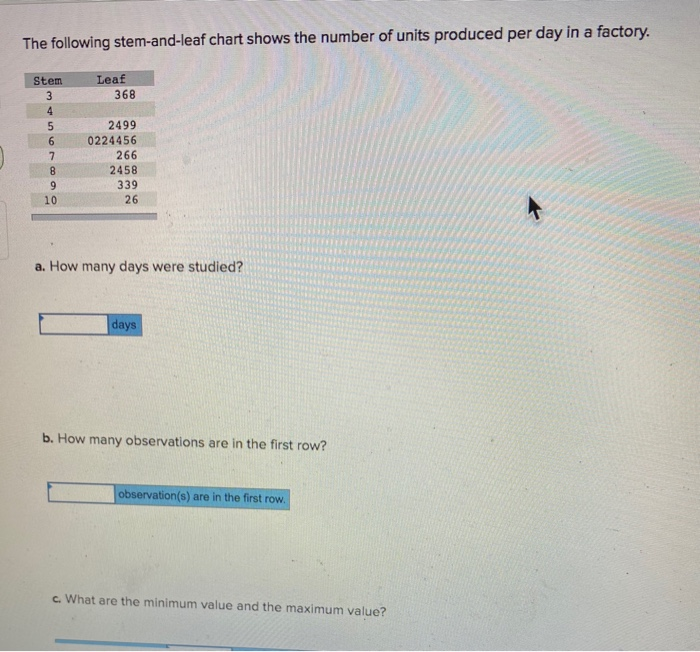
The following stem-and-leaf chart shows the number of units produced per day in a factory. Stem Leaf 368 2499 0224456 266 2458 339 26 a.

Step by Step Solution
There are 3 Steps involved in it
Step: 1

Get Instant Access to Expert-Tailored Solutions
See step-by-step solutions with expert insights and AI powered tools for academic success
Step: 2

Step: 3
Ace Your Homework with AI
Get the answers you need in no time with our AI-driven, step-by-step assistance
Get Started
Energy Audit And Survey Of Street Light System A Preliminary Report
Authors: Dr. Manoj Dhondiram Patil
1st Edition
B08GBCWWFY, 979-8676818388