

Answered step by step
Verified Expert Solution
Question
1 Approved Answer
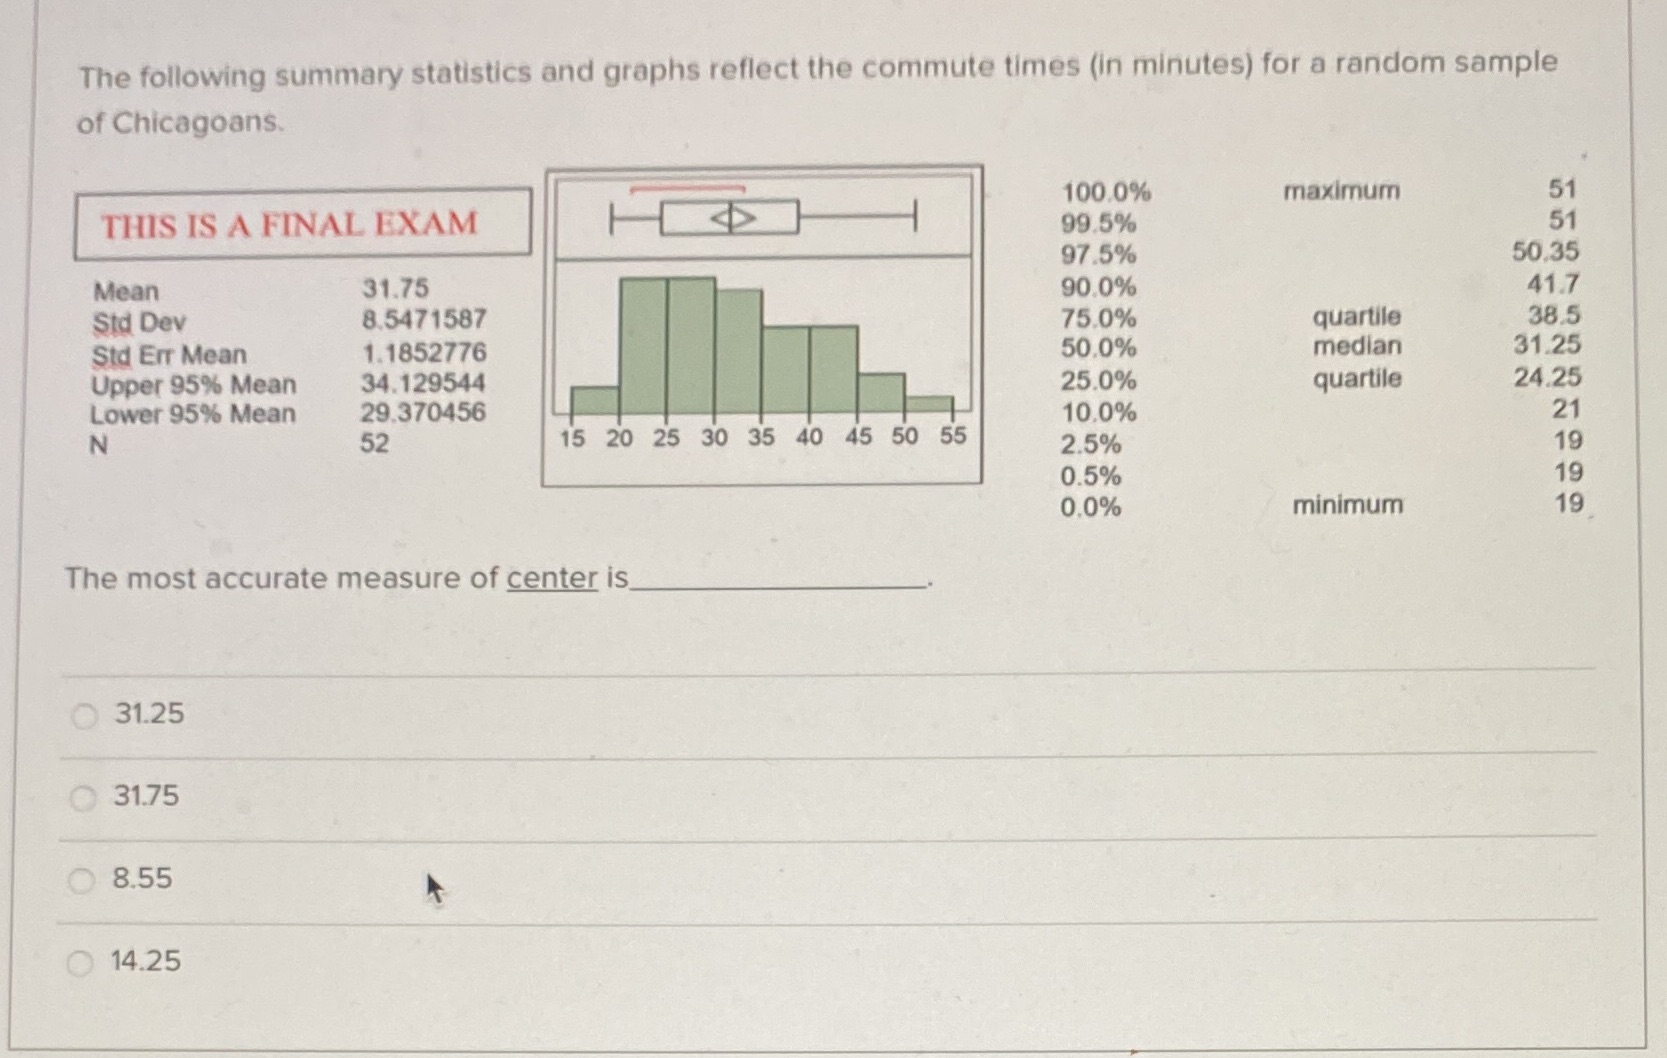
The following summary statistics and graphs reflect the commute times (in minutes) for a random sample of Chicagoans. 100.0% maximum 51 THIS IS A FINAL

Step by Step Solution
There are 3 Steps involved in it
Step: 1

Get Instant Access to Expert-Tailored Solutions
See step-by-step solutions with expert insights and AI powered tools for academic success
Step: 2

Step: 3
Ace Your Homework with AI
Get the answers you need in no time with our AI-driven, step-by-step assistance
Get Started
Fundamentals Of Number Theory
Authors: William J LeVeque
1st Edition
0486141500, 9780486141503