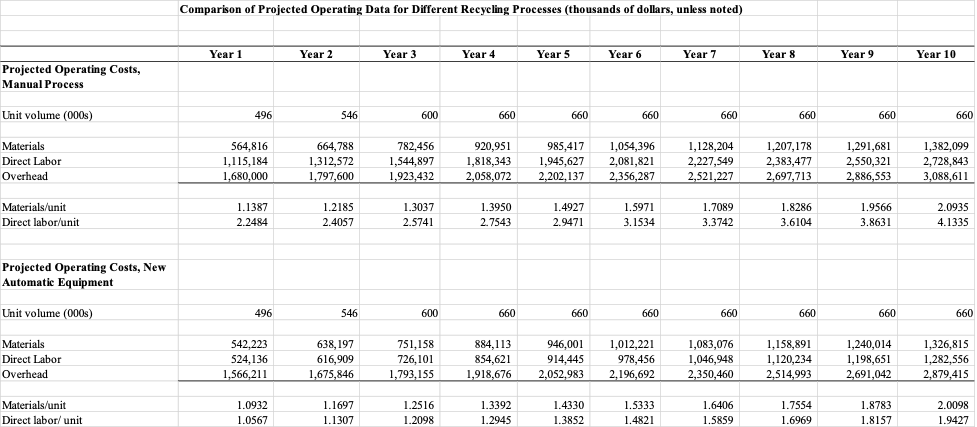
The following table compares projected operating data for the existing recycling process and the proposed automated process, assuming an inflation of 7% per year.
The new equipment would have a useful life of 10 years and would be depreciated under the straight-line method for both tax and financial reporting purposes. Salvage value is likely to equal disposal costs at the end of the useful life. The manual equipment being replaced would last many more years. Currently, it has a book value of 250,000 dollars, and three years of straight-line depreciation remaining. However, its market value is thought to be at about 175,000 dollars. The firms tax rate is 35%.
- Calculate the free cash flows each year associated with this proposed investment.
- If the discount rate is 12%, should the company go ahead with the proposal?
- If the discount rate is 25%, is the proposal still acceptable? Why or why not?
Comparison of Projected Operating Data for Different Recycling Processes (thousands of dollars, unless noted) Year 1 Year 2 Year 3 Year 4 Year 5 Year 6 Year 7 Year 8 Year 9 Year 10 Projected Operating Costs, Manual Process Unit volume (000s) 496 546 600 660 660 660 660 660 660 660 Materials Direct Labor Overhead 564,816 1,115,184 664,788 1,312,572 782,456 1,544,897 1,923,432 920,951 1,818,343 2,058,072 985,417 1,945,627 2,202,137 1,054,396 2,081,821 2,356,287 1,128,204 2,227,549 2,521,227 1,207,178 2,383,477 2,697,713 1,291,681 2,550,321 2,886,553 1,382,099 2,728,843 3,088,611 1,680,000 1.797.600 Materials/unit Direct labor/unit 1.1387 2.2484 1.2185 2.4057 1.3037 2.5741 1.3950 2.7543 1.4927 2.9471 1.5971 3.1534 1.7089 3.3742 1.8286 3.6104 1.9566 3.8631 2.0935 4.1335 Projected Operating Costs, New Automatic Equipment Unit volume 000s) 496 546 600 660 660 660 660 660 660 660 638,197 Materials Direct Labor Overhead 542,223 524,136 1,566,211 616,909 1,675,846 751,158 726, 101 1,793,155 884,113 854,621 1,918,676 946,001 914,445 2,052,983 1,012,221 978,456 2,196,692 1,083,076 1,046,948 2,350,460 1,158,891 1,120,234 2,514,993 1,240,014 1,198,651 2,691,042 1,326,815 1,282.556 2,879,415 Materials/unit Direct labor/ unit 1.0932 1.0567 1.1697 1.1307 1.2516 1.2098 1.3392 1.2945 1.4330 1.3852 1.5333 1.4821 1.6406 1.5859 1.7554 1.6969 1.8783 1.8157 2.0098 1.9427 Comparison of Projected Operating Data for Different Recycling Processes (thousands of dollars, unless noted) Year 1 Year 2 Year 3 Year 4 Year 5 Year 6 Year 7 Year 8 Year 9 Year 10 Projected Operating Costs, Manual Process Unit volume (000s) 496 546 600 660 660 660 660 660 660 660 Materials Direct Labor Overhead 564,816 1,115,184 664,788 1,312,572 782,456 1,544,897 1,923,432 920,951 1,818,343 2,058,072 985,417 1,945,627 2,202,137 1,054,396 2,081,821 2,356,287 1,128,204 2,227,549 2,521,227 1,207,178 2,383,477 2,697,713 1,291,681 2,550,321 2,886,553 1,382,099 2,728,843 3,088,611 1,680,000 1.797.600 Materials/unit Direct labor/unit 1.1387 2.2484 1.2185 2.4057 1.3037 2.5741 1.3950 2.7543 1.4927 2.9471 1.5971 3.1534 1.7089 3.3742 1.8286 3.6104 1.9566 3.8631 2.0935 4.1335 Projected Operating Costs, New Automatic Equipment Unit volume 000s) 496 546 600 660 660 660 660 660 660 660 638,197 Materials Direct Labor Overhead 542,223 524,136 1,566,211 616,909 1,675,846 751,158 726, 101 1,793,155 884,113 854,621 1,918,676 946,001 914,445 2,052,983 1,012,221 978,456 2,196,692 1,083,076 1,046,948 2,350,460 1,158,891 1,120,234 2,514,993 1,240,014 1,198,651 2,691,042 1,326,815 1,282.556 2,879,415 Materials/unit Direct labor/ unit 1.0932 1.0567 1.1697 1.1307 1.2516 1.2098 1.3392 1.2945 1.4330 1.3852 1.5333 1.4821 1.6406 1.5859 1.7554 1.6969 1.8783 1.8157 2.0098 1.9427