Answered step by step
Verified Expert Solution
Question
1 Approved Answer
The following table contains GDP per capita for five countries over a 10-year period between 2002 and 2011. You want to know the rate of
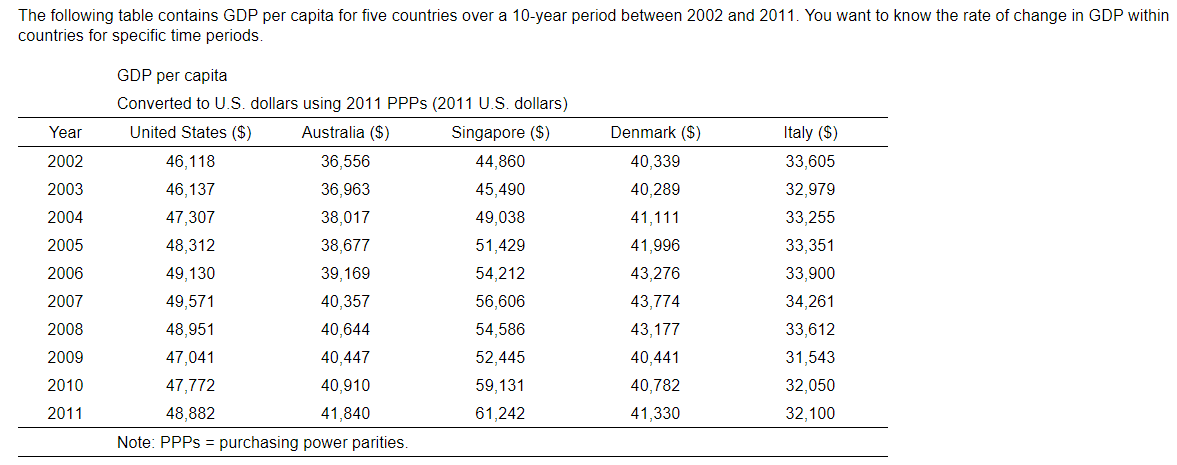
The following table contains GDP per capita for five countries over a 10-year period between 2002 and 2011. You want to know the rate of change in GDP within countries for specific time periods. Year Denmark ($) 40,339 2002 40.289 41,111 2003 2004 2005 2006 2007 2008 2009 GDP per capita Converted to U.S. dollars using 2011 PPPs (2011 U.S. dollars) United States ($) Australia ($) Singapore ($) 46,118 36,556 44,860 46,137 36,963 45,490 47,307 38,017 49,038 48,312 38,677 51,429 49,130 39,169 54,212 40,357 56,606 48,951 40,644 54,586 47,041 40,447 52,445 47,772 40,910 59,131 48,882 41,840 61,242 Note: PPPs = purchasing power parities. 41,996 43,276 43,774 43,177 Italy ($) 33,605 32,979 33,255 33,351 33,900 34,261 33,612 31,543 32,050 32,100 49,571 40,441 40,782 2010 2011 41,330 The five-year change in GDP per capita (2002 through 2006) for the United States was %. Round your response to the nearest hundredths place. The five-year change in GDP per capita (2002 through 2006) for the Australia was 1%. Round your response to the nearest hundredths place. The five-year change in GDP per capita (2002 through 2006) for the Singapore was %. Round your response to the nearest hundredths place. The five-year change in GDP per capita (2002 through 2006) for the Denmark was %. Round your response to the nearest hundredths place. The five-year change in GDP per capita (2002 through 2006) for the Italy was %. Round your response to the nearest hundredths place
Step by Step Solution
There are 3 Steps involved in it
Step: 1
Get Instant Access to Expert-Tailored Solutions
See step-by-step solutions with expert insights and AI powered tools for academic success
Step: 2
Step: 3
Ace Your Homework with AI
Get the answers you need in no time with our AI-driven, step-by-step assistance
Get Started