

Answered step by step
Verified Expert Solution
Question
1 Approved Answer
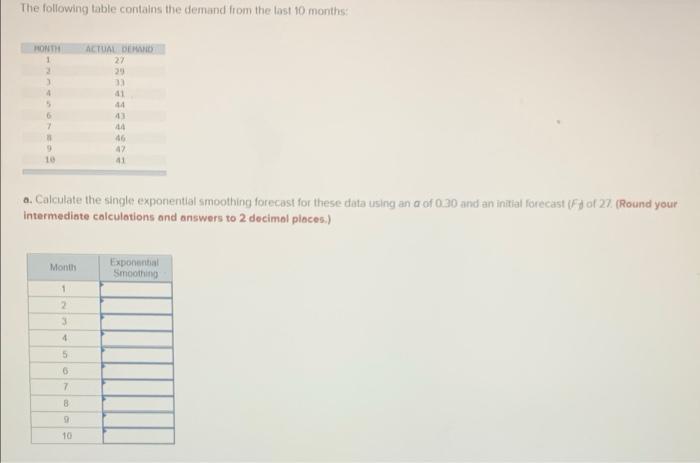
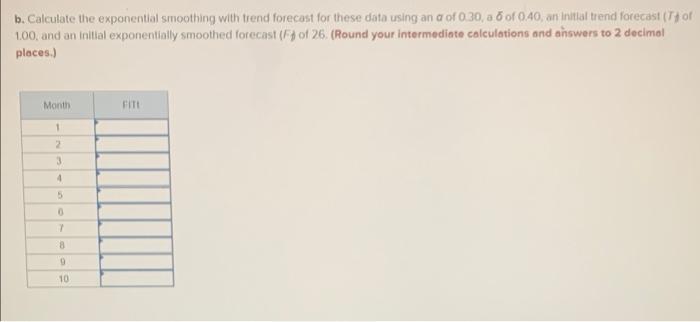
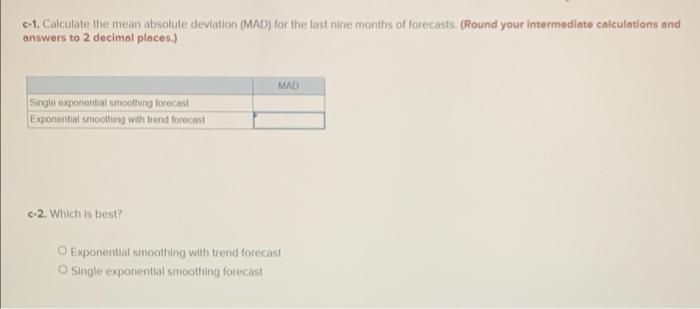
The following table contains the demand from the last 10 months HONTH ACTUAL DEMAND 27 39 41 14 4 47 41 a. Calculate the singler
Step by Step Solution
There are 3 Steps involved in it
Step: 1

Get Instant Access to Expert-Tailored Solutions
See step-by-step solutions with expert insights and AI powered tools for academic success
Step: 2

Step: 3
Ace Your Homework with AI
Get the answers you need in no time with our AI-driven, step-by-step assistance
Get Started
Corporate Finance
Authors: David J. Moore Ph.D
4th Edition
1517212685, 9781517212681