

Answered step by step
Verified Expert Solution
Question
1 Approved Answer
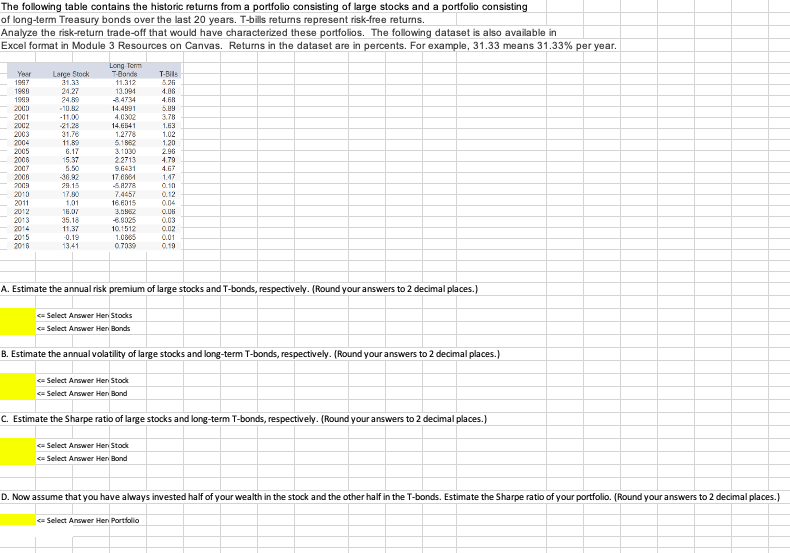
The following table contains the historic returns from a portfolio consisting of large stocks and a portfolio consisting of long - term Treasury bonds over
The following table contains the historic returns from a portfolio consisting of large stocks and a portfolio consisting
of longterm Treasury bonds over the last years. Tbills returns represent riskfree returns.
Analyze the riskreturn tradeoff that would have characterized these portfolios. The following dataset is also available in
Excel format in Module Resources on Canvas. Returns in the dataset are in percents. For example, means per year.
A Estimate the annual risk premium of large stocks and Tbonds, respectively. Round your answers to decimal places.
B Estimate the annual volatility of large stocks and longterm Tbonds, respectively. Round your answers to decimal places.
C Estimate the Sharpe ratio of large stocks and longterm Tbonds, respectively. Round your answers to decimal places.
Step by Step Solution
There are 3 Steps involved in it
Step: 1

Get Instant Access to Expert-Tailored Solutions
See step-by-step solutions with expert insights and AI powered tools for academic success
Step: 2

Step: 3
Ace Your Homework with AI
Get the answers you need in no time with our AI-driven, step-by-step assistance
Get Started
Own Your Money
Authors: Michela Allocca
1st Edition
0760381127, 978-0760381120