Answered step by step
Verified Expert Solution
Link Copied!

Question

1 Approved Answer

The following table contains the historic returns from large stocks and long-term Treasury bonds over the last 20 years. Analyze the risk-return trade-off that would
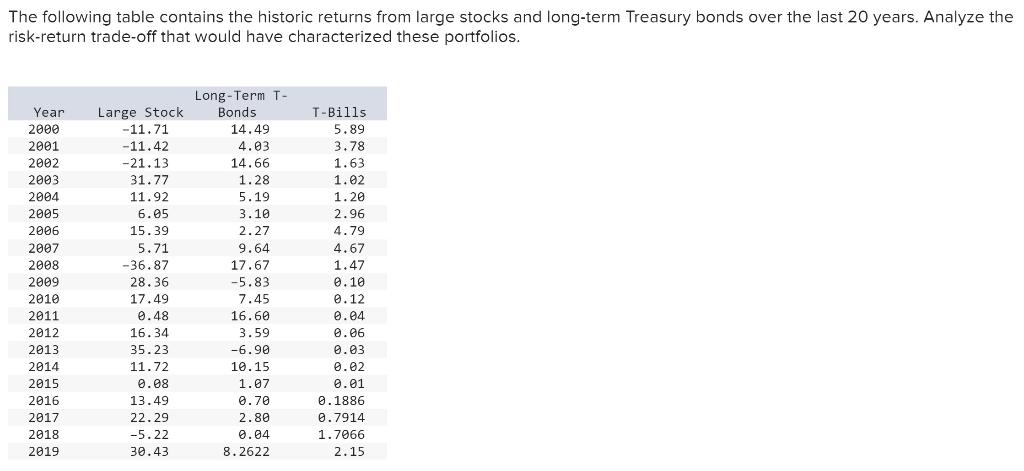
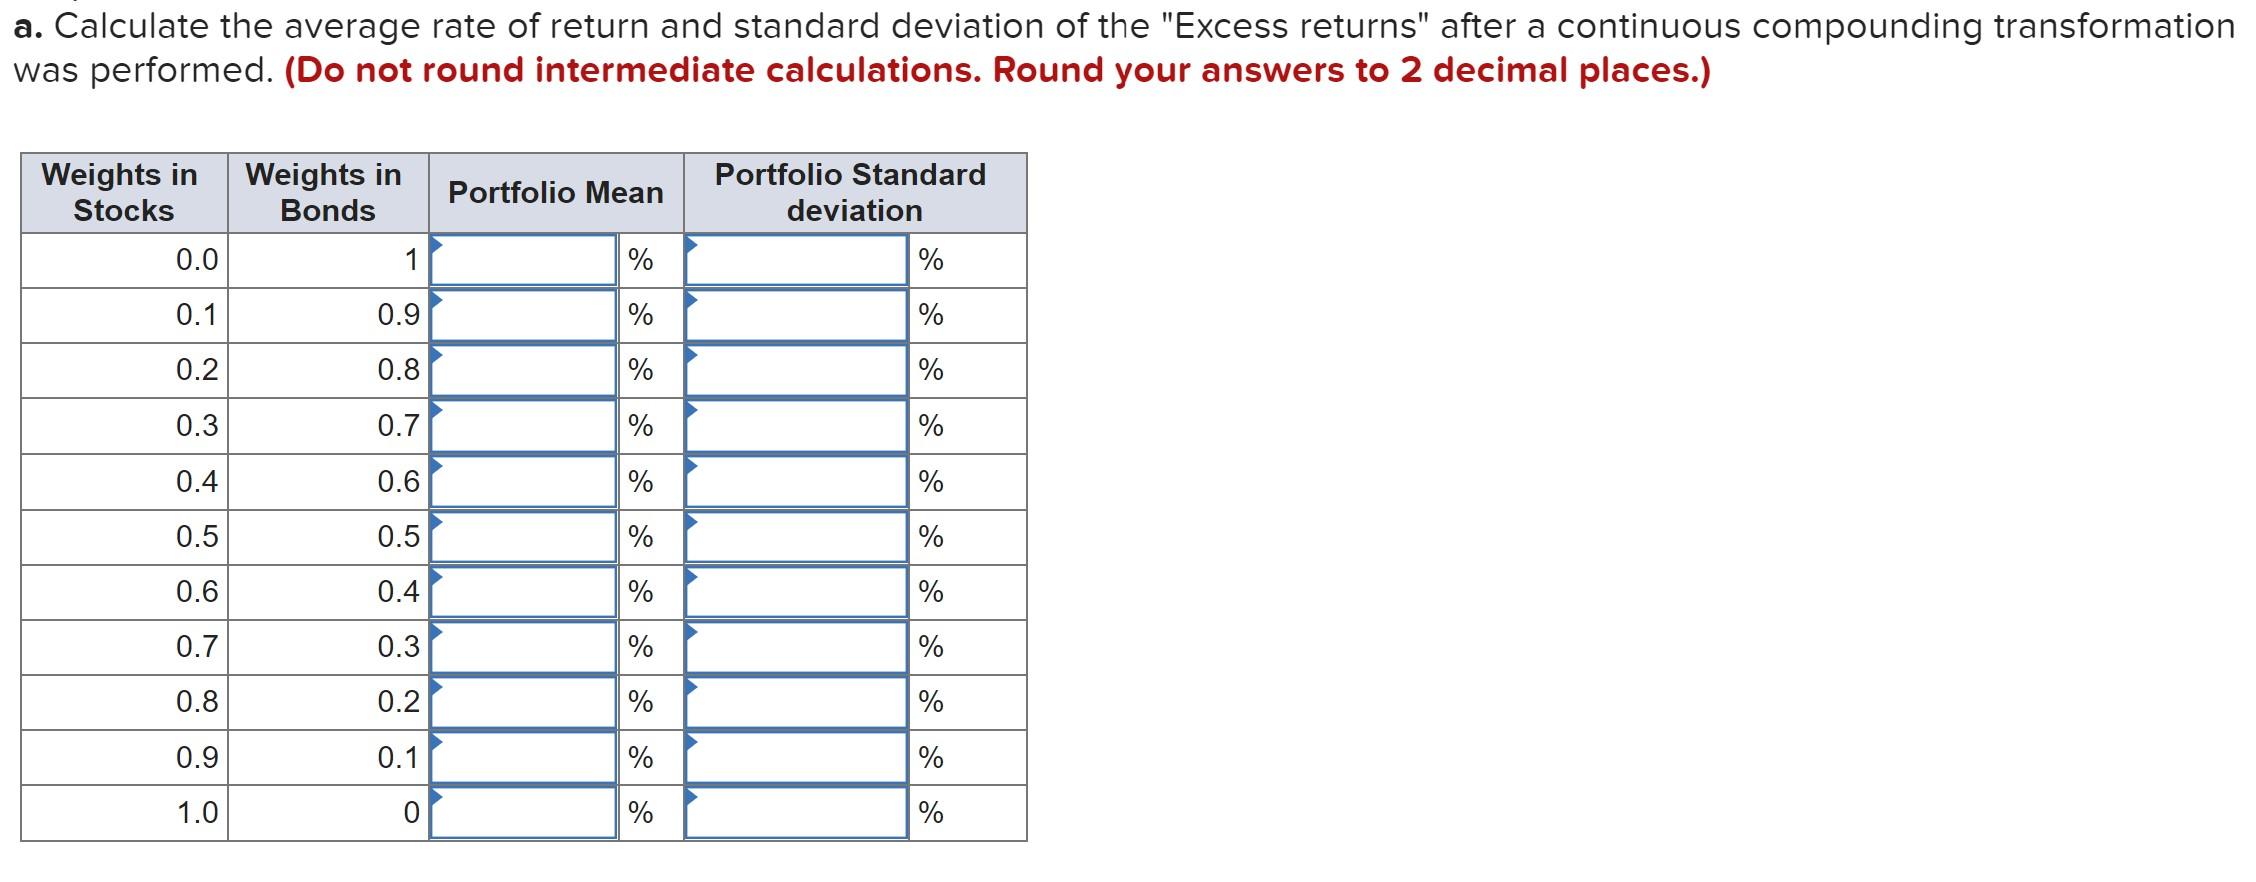
image text in transcribedimage text in transcribedimage text in transcribed

The following table contains the historic returns from large stocks and long-term Treasury bonds over the last 20 years. Analyze the risk-return trade-off that would have characterized these portfolios. T-Bills 5.89 Year 2000 2001 2002 2003 2004 2005 2006 2007 2008 2009 2010 2011 2012 2013 2014 2015 2016 2017 2018 2019 Large Stock -11.71 -11.42 -21.13 31.77 11.92 6.05 15.39 5.71 -36.87 28.36 17.49 0.48 16.34 35.23 11.72 0.08 13.49 22.29 -5.22 30.43 Long-Term T- Bonds 14.49 4.03 14.66 1.28 5.19 3.10 2.27 9.64 17.67 -5.83 7.45 16.60 3.59 -6.90 10.15 1.07 0.70 2.80 0.04 8.2622 3.78 1.63 1.02 1.20 2.96 4.79 4.67 1.47 0.10 0.12 0.04 0.06 0.03 0.02 0.01 0.1886 0.7914 1.7066 2.15 a. Calculate the average rate of return and standard deviation of the "Excess returns" after a continuous compounding transformation was performed. (Do not round intermediate calculations. Round your answers to 2 decimal places.) Weights in Stocks Weights in Bonds Portfolio Mean Portfolio Standard deviation % 0.0 1 % 0.1 0.9 % % 0.2 0.8 % % 0.3 0.7 % % 0.4 0.6 % % 0.5 0.5 % % 0.6 0.4 % % 0.7 0.3 % % 0.8 0.2 % % 0.9 0.1 % % 1.0 O % % d. What were the average return and standard deviation of the minimum-variance combination of stocks and bonds? (Do not round intermediate calculations. Round your answers to 2 decimal places.) Weights Weights in in Stocks Bonds Portfolio Mean Portfolio Standard deviation Minimum-Variance 0.1938 0.8062 % % The following table contains the historic returns from large stocks and long-term Treasury bonds over the last 20 years. Analyze the risk-return trade-off that would have characterized these portfolios. T-Bills 5.89 Year 2000 2001 2002 2003 2004 2005 2006 2007 2008 2009 2010 2011 2012 2013 2014 2015 2016 2017 2018 2019 Large Stock -11.71 -11.42 -21.13 31.77 11.92 6.05 15.39 5.71 -36.87 28.36 17.49 0.48 16.34 35.23 11.72 0.08 13.49 22.29 -5.22 30.43 Long-Term T- Bonds 14.49 4.03 14.66 1.28 5.19 3.10 2.27 9.64 17.67 -5.83 7.45 16.60 3.59 -6.90 10.15 1.07 0.70 2.80 0.04 8.2622 3.78 1.63 1.02 1.20 2.96 4.79 4.67 1.47 0.10 0.12 0.04 0.06 0.03 0.02 0.01 0.1886 0.7914 1.7066 2.15 a. Calculate the average rate of return and standard deviation of the "Excess returns" after a continuous compounding transformation was performed. (Do not round intermediate calculations. Round your answers to 2 decimal places.) Weights in Stocks Weights in Bonds Portfolio Mean Portfolio Standard deviation % 0.0 1 % 0.1 0.9 % % 0.2 0.8 % % 0.3 0.7 % % 0.4 0.6 % % 0.5 0.5 % % 0.6 0.4 % % 0.7 0.3 % % 0.8 0.2 % % 0.9 0.1 % % 1.0 O % % d. What were the average return and standard deviation of the minimum-variance combination of stocks and bonds? (Do not round intermediate calculations. Round your answers to 2 decimal places.) Weights Weights in in Stocks Bonds Portfolio Mean Portfolio Standard deviation Minimum-Variance 0.1938 0.8062 % %

Step by Step Solution

There are 3 Steps involved in it

Step: 1

blur-text-image

Get Instant Access to Expert-Tailored Solutions

See step-by-step solutions with expert insights and AI powered tools for academic success

Step: 2

blur-text-image

Step: 3

blur-text-image

Ace Your Homework with AI

Get the answers you need in no time with our AI-driven, step-by-step assistance

Get Started

Recommended Textbook for

The Everything Guide To Day Trading

Authors: David Borman

1st Edition

1440506213, 978-1440506215

More Books

Students also viewed these Finance questions