Answered step by step
Verified Expert Solution
Question
1 Approved Answer
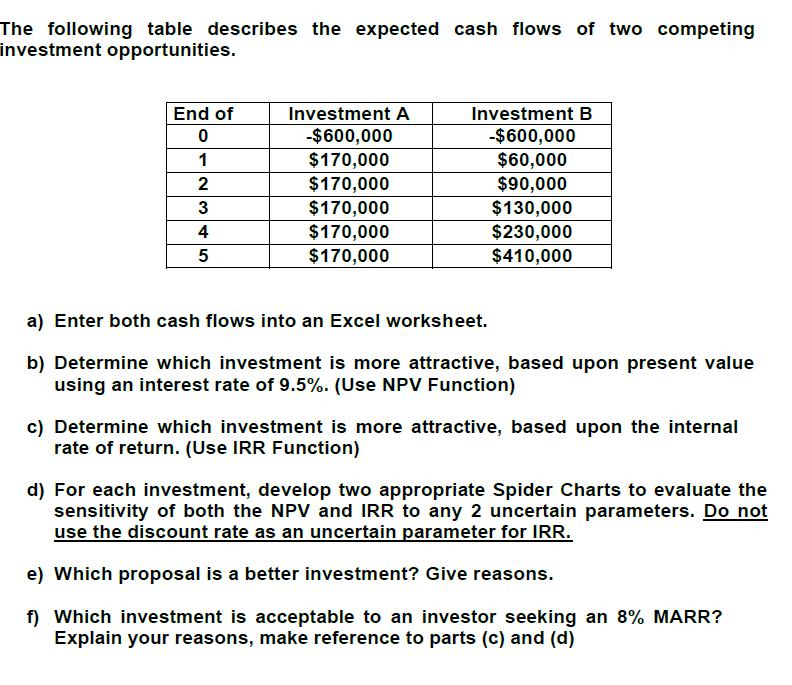
The following table describes the expected cash flows of two competing investment opportunities. End of Investment A Investment B 0 -$600,000 -$600,000 1 $170,000

The following table describes the expected cash flows of two competing investment opportunities. End of Investment A Investment B 0 -$600,000 -$600,000 1 $170,000 $60,000 2 $170,000 $90,000 3 $170,000 $130,000 4 $170,000 $230,000 5 $170,000 $410,000 a) Enter both cash flows into an Excel worksheet. b) Determine which investment is more attractive, based upon present value using an interest rate of 9.5%. (Use NPV Function) c) Determine which investment is more attractive, based upon the internal rate of return. (Use IRR Function) d) For each investment, develop two appropriate Spider Charts to evaluate the sensitivity of both the NPV and IRR to any 2 uncertain parameters. Do not use the discount rate as an uncertain parameter for IRR. e) Which proposal is a better investment? Give reasons. f) Which investment is acceptable to an investor seeking an 8% MARR? Explain your reasons, make reference to parts (c) and (d)
Step by Step Solution
There are 3 Steps involved in it
Step: 1
a Excel worksheet with cash flows End of Year Investment A Investment B 0 600000 600000 1 170000 600...
Get Instant Access to Expert-Tailored Solutions
See step-by-step solutions with expert insights and AI powered tools for academic success
Step: 2

Step: 3

Ace Your Homework with AI
Get the answers you need in no time with our AI-driven, step-by-step assistance
Get Started


