Question
The following table details a FOW analyst's prediction of the probabilities of different states of the market over the next year, along with the

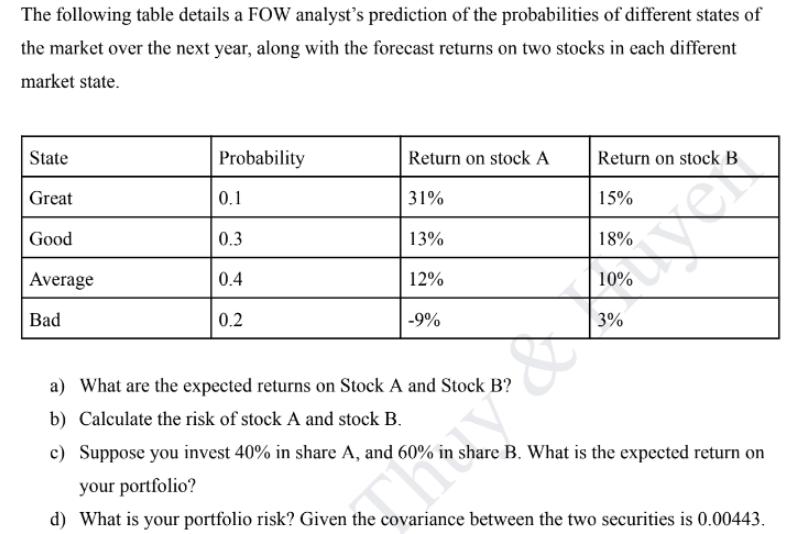
The following table details a FOW analyst's prediction of the probabilities of different states of the market over the next year, along with the forecast returns on two stocks in each different market state. State Great Good Average Bad Probability 0.1 0.3 0.4 0.2 Return on stock A 31% 13% 12% -9% Return on stock B 15% 18% 10% 3% a) What are the expected returns on Stock A and Stock B? b) Calculate the risk of stock A and stock B. c) Suppose you invest 40% in share A, and 60% in share B. What is the expected return on your portfolio? d) What is your portfolio risk? Given the covariance between the two securities is 0.00443.
Step by Step Solution
3.33 Rating (165 Votes )
There are 3 Steps involved in it
Step: 1
Solution a The expected returns on Stock A and Stock B can be calculated by weighting the returns in ...
Get Instant Access to Expert-Tailored Solutions
See step-by-step solutions with expert insights and AI powered tools for academic success
Step: 2

Step: 3

Ace Your Homework with AI
Get the answers you need in no time with our AI-driven, step-by-step assistance
Get StartedRecommended Textbook for
Personal Finance
Authors: Thomas Garman, Raymond Forgue
12th edition
9781305176409, 1133595839, 1305176405, 978-1133595830
Students also viewed these Finance questions
Question
Answered: 1 week ago
Question
Answered: 1 week ago
Question
Answered: 1 week ago
Question
Answered: 1 week ago
Question
Answered: 1 week ago
Question
Answered: 1 week ago
Question
Answered: 1 week ago
Question
Answered: 1 week ago
Question
Answered: 1 week ago
Question
Answered: 1 week ago
Question
Answered: 1 week ago
Question
Answered: 1 week ago
Question
Answered: 1 week ago
Question
Answered: 1 week ago
Question
Answered: 1 week ago
Question
Answered: 1 week ago
Question
Answered: 1 week ago
Question
Answered: 1 week ago
Question
Answered: 1 week ago
Question
Answered: 1 week ago
Question
Answered: 1 week ago
Question
Answered: 1 week ago
View Answer in SolutionInn App


