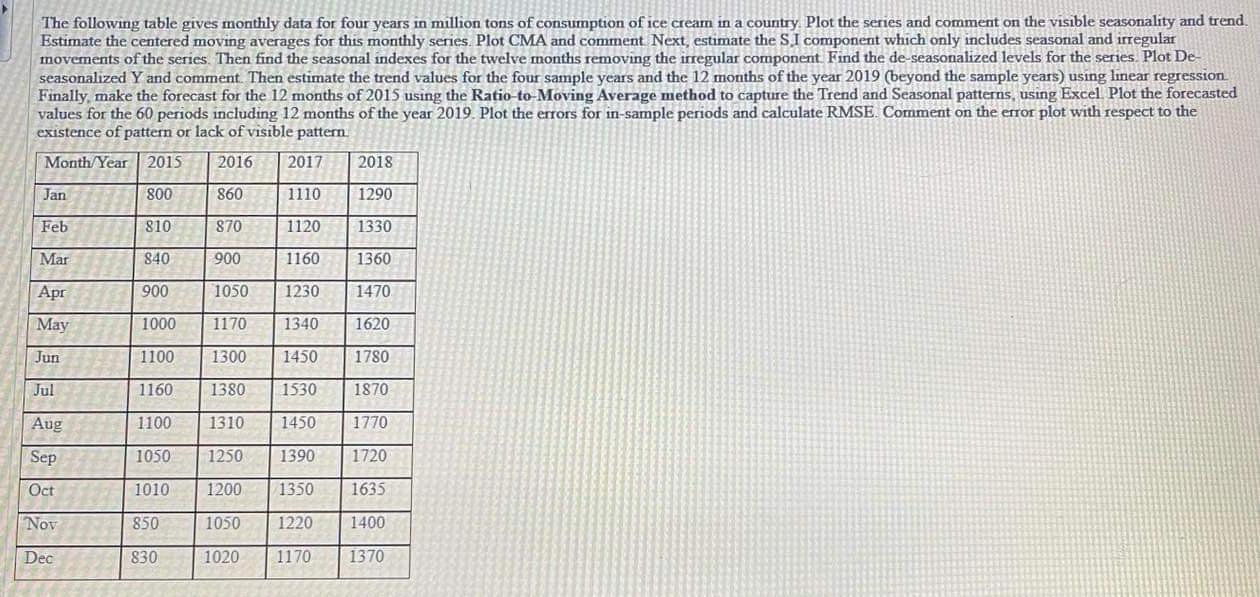
The following table gives monthly data for four years in million tons of consumption of ice...
Fantastic news! We've Found the answer you've been seeking!
Question:
Transcribed Image Text:
The following table gives monthly data for four years in million tons of consumption of ice cream in a country. Plot the series and comment on the visible seasonality and trend. Estimate the centered moving averages for this monthly series. Plot CMA and comment. Next, estimate the SI component which only includes seasonal and irregular movements of the series. Then find the seasonal indexes for the twelve months removing the irregular component. Find the de-seasonalized levels for the series. Plot De- seasonalized Y and comment. Then estimate the trend values for the four sample years and the 12 months of the year 2019 (beyond the sample years) using linear regression. Finally, make the forecast for the 12 months of 2015 using the Ratio-to-Moving Average method to capture the Trend and Seasonal patterns, using Excel. Plot the forecasted values for the 60 periods including 12 months of the year 2019. Plot the errors for in-sample periods and calculate RMSE. Comment on the error plot with respect to the existence of pattern or lack of visible pattern. Month/Year 2015 2016 2017 800 860 1110 810 870 1120 840 900 1160 1050 1230 1340 Jan Feb Mar Apr May Jun Jul Aug Sep Oct Nov Dec 900 1000 1170 1100 1300 1450 1780 1160 1380 1530 1870 1100 1310 1450 1770 1050 1250 1390 1720 1010 1200 1350 1635 850 1400 830 1050 1020 1220 2018 1290 1330 1360 1470 1620 1170 1370 The following table gives monthly data for four years in million tons of consumption of ice cream in a country. Plot the series and comment on the visible seasonality and trend. Estimate the centered moving averages for this monthly series. Plot CMA and comment. Next, estimate the SI component which only includes seasonal and irregular movements of the series. Then find the seasonal indexes for the twelve months removing the irregular component. Find the de-seasonalized levels for the series. Plot De- seasonalized Y and comment. Then estimate the trend values for the four sample years and the 12 months of the year 2019 (beyond the sample years) using linear regression. Finally, make the forecast for the 12 months of 2015 using the Ratio-to-Moving Average method to capture the Trend and Seasonal patterns, using Excel. Plot the forecasted values for the 60 periods including 12 months of the year 2019. Plot the errors for in-sample periods and calculate RMSE. Comment on the error plot with respect to the existence of pattern or lack of visible pattern. Month/Year 2015 2016 2017 800 860 1110 810 870 1120 840 900 1160 1050 1230 1340 Jan Feb Mar Apr May Jun Jul Aug Sep Oct Nov Dec 900 1000 1170 1100 1300 1450 1780 1160 1380 1530 1870 1100 1310 1450 1770 1050 1250 1390 1720 1010 1200 1350 1635 850 1400 830 1050 1020 1220 2018 1290 1330 1360 1470 1620 1170 1370
Expert Answer:
Answer rating: 100% (QA)
Answer Trend and Seasonal Movement in Ice Cream Consumption The table given above shows monthly data for four years in million tons of consumption of ice cream for a country In order to better underst... View the full answer
Related Book For
Applied Regression Analysis and Other Multivariable Methods
ISBN: 978-1285051086
5th edition
Authors: David G. Kleinbaum, Lawrence L. Kupper, Azhar Nizam, Eli S. Rosenberg
Posted Date:
Students also viewed these mathematics questions
-
The following table gives the top five television shows, as determined by the Nielsen Ratings for the week ending October 19, 2008. Identify the type of data provided by the information in each...
-
The following table gives the temperatures (in degrees Fahrenheit) at 6 PM and the attendance (rounded to hundreds) at a minor league baseball teams night games on 7 randomly selected evenings in...
-
The following table gives the systolic blood pressure (SBP), body size (QUET), age (AGE), and smoking history (SMK = 0 if a nonsmoker, SMK = 1 if a current or previous smoker) for a hypothetical...
-
The enzyme Stell participates in several distinct MAP kinase signaling pathways in the budding yeast S. cerevisiae. What is the substrate for Ste 11 in the mating factor signaling pathway? When a...
-
The bookkeeper at Jefferson Company has not reconciled the bank statement with the Cash account, saying, I dont have time. You have been asked to prepare a reconciliation and review the procedures...
-
Refer to Exercise 13.82. Construct a 99% confidence interval for the mean bounce height of all basketballs that are inflated to 8.5 psi. Construct a 99% prediction interval for the bounce height of a...
-
You have just purchased a new car, making a down payment of \(\$ 8,000\) and financing the balance of the purchase cost on an installment credit plan. According to the credit agreement, you will pay...
-
On January 3, 2016, Wayne Co. paid $280,000 for a computer system. In addition to the basic purchase price, the company paid a setup fee of $1,900, sales tax of $7,000, and $28,600 for a special...
-
Explore the best practices for evaluating "What Wows?" using multiple napkin pitches.
-
CASH PAID FOR MERCHANDISE Guild Company's cost of goods sold for 20-2 was $500,000. Compute the amount of cash paid for merchandise in 20-2. The December 31, 20-2 and 20-1, balances of Merchandise...
-
Given the provided stack match the description that correlates with the step on the stack. Question 2 Given the provided stack match the descirption that correlates with the step on the stack. (Not a...
-
What is a cam? What is its use?
-
An auditor's working papers should a. Not be permitted to serve as a reference source for the client. b. Not contain critical comments concerning management. c. Show that the accounting records agree...
-
What is a double Hookes joint? What is its use?
-
Name the three procedures the auditor uses to obtain an understanding of relevant internal control policies and procedures.
-
Where do we use multi-plate clutches?
-
CHALLENGE ACTIVITY 2.5.1: Acceleration of gravity. Compute the acceleration of gravity for a given distance from the earth's center, distCenter, assigning the result to accelGravity. The expression...
-
Explain why each of the following is either a private good or a public good: traffic lights, in line skates, a city park, a chicken salad sandwich, a tennis racket, national defense, a coastal...
-
In September 1996, U.S. News & World Report published a report on America's health maintenance organizations (HMOs). The report was intended to serve as a consumer guide to HMO quality. For each HMO...
-
The data in the accompanying table were sampled from U.S. News & World Report's 1996 story on the "Best Mutual Funds." The following variables are shown for each fund: CAT (fund category): 1 =...
-
Data on sales revenue Y, television advertising expenditures X1, and print media advertising expenditures X2 for a large retailer for the period 1988-1993 were given in Problem 11 of Chapter 8. Use...
-
Briefly describe the concept of weighted average cost of capital.
-
A company plans to accumulate 75% of its needed investment capital by issuing bonds having a capital cost percentage of 12%; the balance will be raised by issuing stock having a capital cost...
-
In what sense does the cost of capital limit a firms investment considerations?
Study smarter with the SolutionInn App