Question
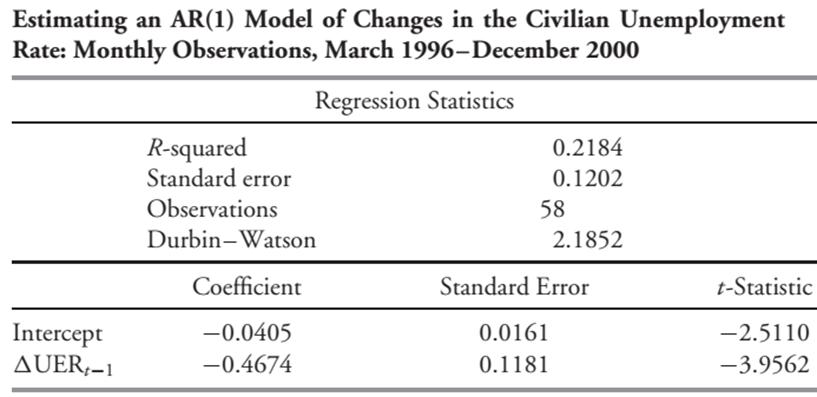
The following table gives the regression output of an AR(1) model on first differences in the unemployment rate. Assume that changes in the civilian unemployment
The following table gives the regression output of an AR(1) model on first differences in the unemployment rate.

Assume that changes in the civilian unemployment rate are covariance stationary and that an AR(1) model is a good description for the time series of changes in the unemployment rate.
1. Describe how to interpret the DW statistic for this regression.
2. What is the mean-reverting level to which changes in the unemployment rate converge?
3. The current change (first difference) in the unemployment rate is 0.0300. Assume that the mean-reverting level for changes in the unemployment rate is -0.0276.
A. What is the best prediction of the next change?
B. What is the prediction of the change following the next change?
Estimating an AR(1) Model of Changes in the Civilian Unemployment Rate: Monthly Observations, March 1996-December 2000 Regression Statistics Intercept AUER-1 R-squared Standard error Observations Durbin-Watson Coefficient -0.0405 -0.4674 0.2184 0.1202 58 0.0161 0.1181 2.1852 Standard Error t-Statistic -2.5110 -3.9562
Step by Step Solution
3.47 Rating (160 Votes )
There are 3 Steps involved in it
Step: 1
1 The DurbinWatson DW statistic measures the presence of autocorrelation in the regression residuals ...
Get Instant Access to Expert-Tailored Solutions
See step-by-step solutions with expert insights and AI powered tools for academic success
Step: 2

Step: 3

Ace Your Homework with AI
Get the answers you need in no time with our AI-driven, step-by-step assistance
Get Started


