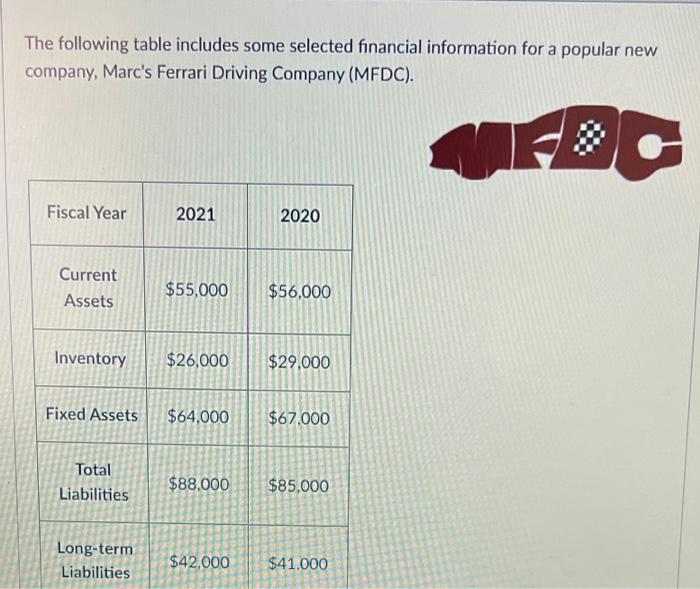
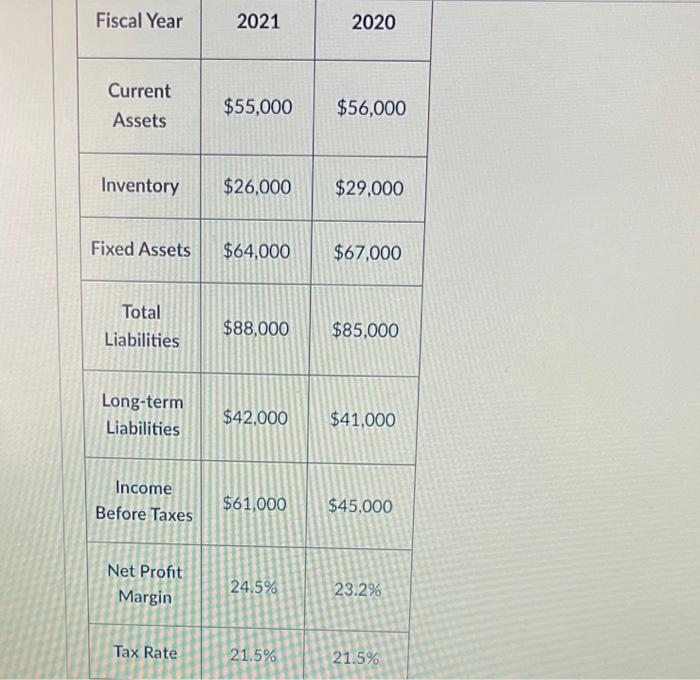
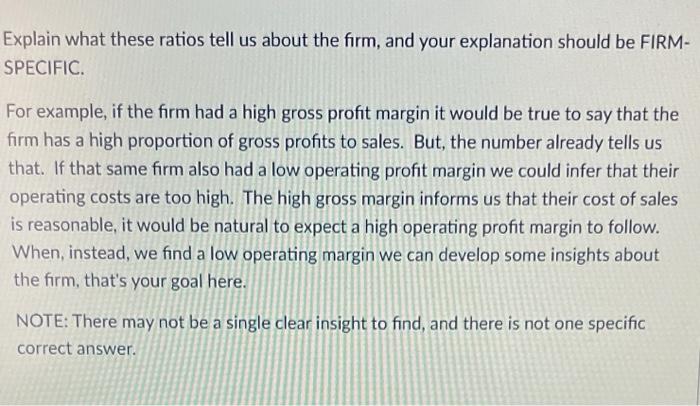
The following table includes some selected financial information for a popular new company, Marc's Ferrari Driving Company (MFDC). Fiscal Year 2021 2020 Current Assets $55,000 $56,000 Inventory $26,000 $29,000 Fixed Assets $64,000 $67,000 Total Liabilities $88,000 $85.000 Long-term Liabilities $42,000 $41,000 Fiscal Year 2021 2020 Current Assets $55,000 $56,000 Inventory $26,000 $29,000 Fixed Assets $64,000 $67,000 Total Liabilities $88,000 $85,000 Long-term Liabilities $42.000 $41,000 Income Before Taxes $61,000 $45,000 Net Profit Margin 24.5% 23.2% Tax Rate 21.5% 21.5% What is the debt ratio for MFDC in 2021? (answer in decimal form, not a percentage. For example, answer 1.3 if you determined the debt ratio was 130% or 1.3) What was the quick ratio for MFDC in 2021? (answer in decimal form, not a percentage. For example, answer 1.3 if you determined the quick ratio was 130% or 1.3) What was the return on equity for MFDC in 2020? (answer in percentage form. For example, answer 12.3 if you determined the return on equity was 12.3%) If you were to prepare a common-sized income statement for MFDC, what value would you show for the Income Before Taxes in 2020? (answer in percentage form. For example, answer 12.3% if you determined the common-sized Income Before Taxes was 12.3%) Explain what these ratios tell us about the firm, and your explanation should be FIRM- SPECIFIC. a For example, if the firm had a high gross profit margin it would be true to say that the firm has a high proportion of gross profits to sales. But, the number already tells us that. If that same firm also had a low operating profit margin we could infer that their operating costs are too high. The high gross margin informs us that their cost of sales is reasonable, it would be natural to expect a high operating profit margin to follow. When, instead, we find a low operating margin we can develop some insights about the firm, that's your goal here. NOTE: There may not be a single clear insight to find, and there is not one specific correct