Question
The following table reports new car sales for a Volvo dealership in Allentown, PA in the last 8 months along with two forecast techniques F1
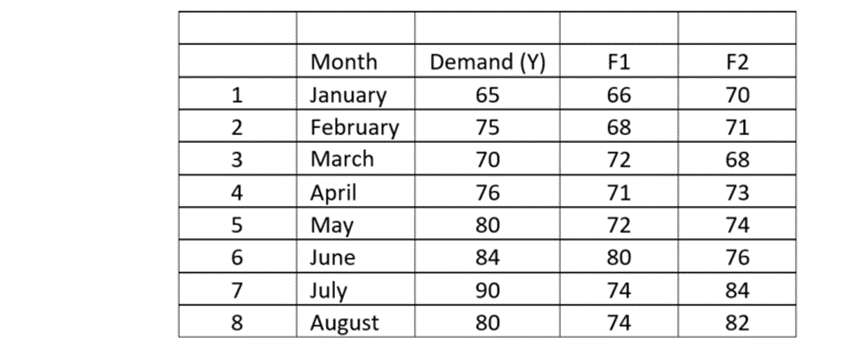
The following table reports new car sales for a Volvo dealership in Allentown, PA in the last 8 months along with two forecast techniques F1 and F2.

a. Compute the mean absolute deviation (MAD) for each set of forecasts, which forecast appears to be more accurate? Explain b. Compute the mean absolute percentage error (MAPE) for each set of forecasts, which forecast appears to be more accurate? Explain c. In practice, either MAD or MAPE would be employed to compare forecast accuracies. What factors might lead the manager to choose one rather than the other?
\begin{tabular}{|c|l|c|c|c|} \hline & & & & \\ \hline & Month & Demand (Y) & F1 & F2 \\ \hline 1 & January & 65 & 66 & 70 \\ \hline 2 & February & 75 & 68 & 71 \\ \hline 3 & March & 70 & 72 & 68 \\ \hline 4 & April & 76 & 71 & 73 \\ \hline 5 & May & 80 & 72 & 74 \\ \hline 6 & June & 84 & 80 & 76 \\ \hline 7 & July & 90 & 74 & 84 \\ \hline 8 & August & 80 & 74 & 82 \\ \hline \end{tabular}Step by Step Solution
There are 3 Steps involved in it
Step: 1

Get Instant Access to Expert-Tailored Solutions
See step-by-step solutions with expert insights and AI powered tools for academic success
Step: 2

Step: 3

Ace Your Homework with AI
Get the answers you need in no time with our AI-driven, step-by-step assistance
Get Started


