

Question
The following table represents the set of activities required to complete a project, along with their time estimates for PERT calculations. a. Using the data
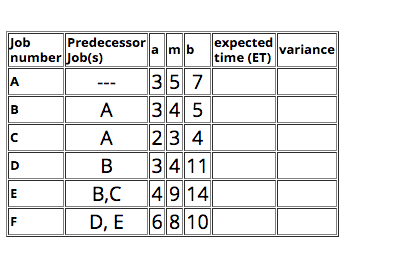
The following table represents the set of activities required to complete a project, along with their time estimates for PERT calculations.
a. Using the data in the table, calculate the expected time (ET) and variance for each activity.
b. [Sketch the network diagram for the project on a sheet of paper.
c. List each unique path through the network. For example, "A, B, C" would indicate a path consisting of activity A, followed by activity B, which is followed by activity C.
d. Indicate the critical path. (You can do this by inspecting the paths -- you do not have to calculate ES, EF, LS, LF.) What is the expected completion time for the project?
e. What is the probability that the project will be completed in 29 days or less?
f. What is the probability that the project will take more than 29 days to complete?
Predecessor a mb expectea variance time (ET) 4 number Job(s) 35 7 A 345 A 2 34 B 3411 BC 4914 D,E 6810 Predecessor a mb expectea variance time (ET) 4 number Job(s) 35 7 A 345 A 2 34 B 3411 BC 4914 D,E 6810
Step by Step Solution
There are 3 Steps involved in it
Step: 1

Get Instant Access to Expert-Tailored Solutions
See step-by-step solutions with expert insights and AI powered tools for academic success
Step: 2

Step: 3
Ace Your Homework with AI
Get the answers you need in no time with our AI-driven, step-by-step assistance
Get Started
Oregon Real Estate Practices Finance Law
Authors: Palmer, Frank
1st Edition
0324137710, 9780324137712