Answered step by step
Verified Expert Solution
Link Copied!

Question

1 Approved Answer

The following table shows 1000 nursing school applicants classified according to scores made on a college entrance examination and the quality of the high school
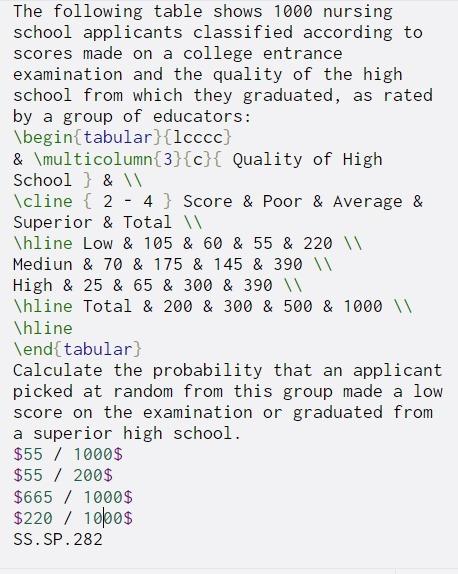
image text in transcribed

The following table shows 1000 nursing school applicants classified according to scores made on a college entrance examination and the quality of the high school from which they graduated, as rated by a group of educators: \begin{tabular}{lcccc} & \multicolumn{3}{c}{ Quality of High School } & \cline { 2 4} Score & Poor & Average & Superior & Total \hline Low & 105 & 60 & 55 & 220 Mediun & 70 & 175 & 145 & 390 High & 25 & 65 & 300 & 390 Thline Total & 200 & 300 & 500 & 1000 W \hline \end{tabular} Calculate the probability that an applicant picked at random from this group made a low score on the examination or graduated from a superior high school. $55 / 1000$ $55 / 200$ $665 / 1000$ $220 / 1000$ SS.SP.282

Step by Step Solution

There are 3 Steps involved in it

Step: 1

blur-text-image

Get Instant Access to Expert-Tailored Solutions

See step-by-step solutions with expert insights and AI powered tools for academic success

Step: 2

blur-text-image_2

Step: 3

blur-text-image_3

Ace Your Homework with AI

Get the answers you need in no time with our AI-driven, step-by-step assistance

Get Started

Recommended Textbook for

More Books

Students also viewed these Databases questions