

Answered step by step
Verified Expert Solution
Question
1 Approved Answer
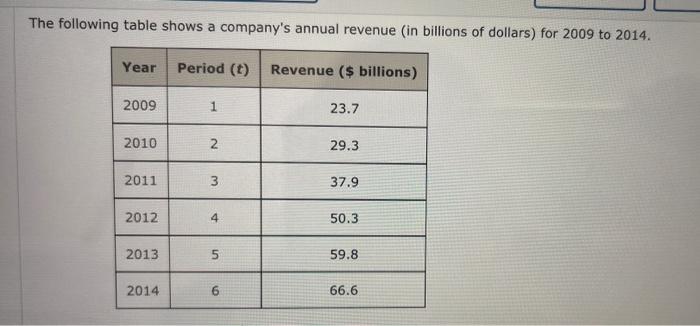
The following table shows a company's annual revenue (in billions of dollars) for 2009 to 2014. Year Period (t) Revenue ($ billions) 2009 1 23.7
Step by Step Solution
There are 3 Steps involved in it
Step: 1

Get Instant Access to Expert-Tailored Solutions
See step-by-step solutions with expert insights and AI powered tools for academic success
Step: 2

Step: 3
Ace Your Homework with AI
Get the answers you need in no time with our AI-driven, step-by-step assistance
Get Started
Understanding The Use Of Financial Accounting Provisions In Private Acquisition Agreements
Authors: Mark L. Stoneman
1st Edition
1627222731, 978-1627222730