Answered step by step
Verified Expert Solution
Link Copied!

Question

1 Approved Answer

The following table shows experimental measurements for both the power P (in W) and the energy E in J) for different values of the velocity
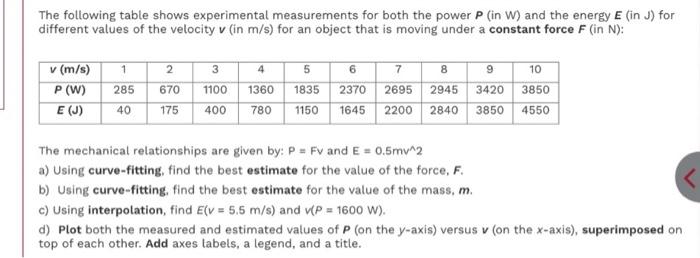
image text in transcribed
The following table shows experimental measurements for both the power P (in W) and the energy E in J) for different values of the velocity v (in m/s) for an object that is moving under a constant force F (in N): v (m/s) P(W) E (J) 1 2 285 670 40 175 3 1100 400 4 5 7 8 9 10 1360 1835 2370 2695 2945 3420 3850 780 1150 1645 2200 2840 3850 4550 The mechanical relationships are given by: P = Fv and E = 0.5m^2 a) Using curve-fitting, find the best estimate for the value of the force, F. b) Using curve-fitting, find the best estimate for the value of the mass, m. c) Using interpolation, find Ev = 5.5 m/s) and (P = 1600 W). d) Plot both the measured and estimated values of P (on the y-axis) versus v (on the x-axis), superimposed on top of each other. Add axes tabels, a legend, and a title

Step by Step Solution

There are 3 Steps involved in it

Step: 1

blur-text-image

Get Instant Access to Expert-Tailored Solutions

See step-by-step solutions with expert insights and AI powered tools for academic success

Step: 2

blur-text-image

Step: 3

blur-text-image

Ace Your Homework with AI

Get the answers you need in no time with our AI-driven, step-by-step assistance

Get Started

Recommended Textbook for

Essential SQLAlchemy Mapping Python To Databases

Authors: Myers, Jason Myers

2nd Edition

1491916567, 9781491916568

More Books

Students also viewed these Databases questions

Question

3. Do all companies have an R&D function? Explain your answer.

Answered: 1 week ago

Question

What is the coefficient for QUANTITATIVE, b2?

Answered: 1 week ago