Answered step by step
Verified Expert Solution
Question
1 Approved Answer
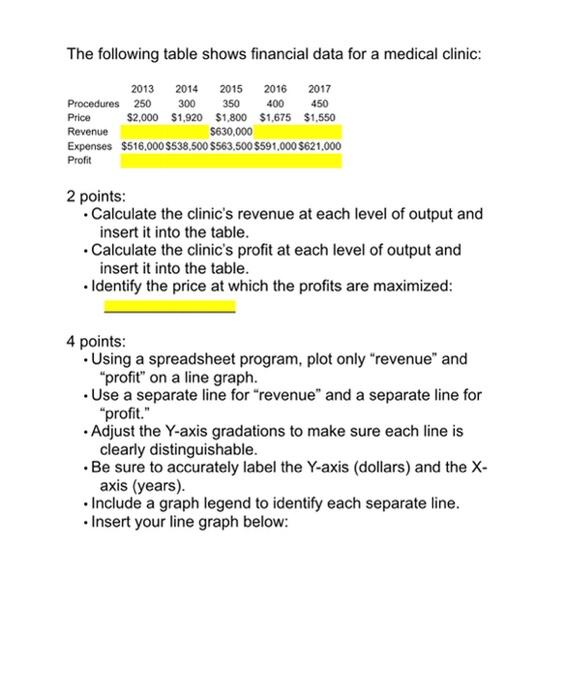
The following table shows financial data for a medical clinic : 2013 2014 2015 2016 2017 Procedures 250 300 350 400 450 Price $2,000 $1,920
The following table shows financial data for a medical clinic:
| 2013 | 2014 | 2015 | 2016 | 2017 |
Procedures | 250 | 300 | 350 | 400 | 450 |
Price | $2,000 | $1,920 | $1,800 | $1,675 | $1,550 |
Revenue |
|
| $630,000 |
|
|
Expenses | $516,000 | $538,500 | $563,500 | $591,000 | $621,000 |
Profit |
|
|
|
|
|
2 points:
Calculate the clinics revenue at each level of output and insert it into the table.
Calculate the clinics profit at each level of output and insert it into the table.
Identify the price at which the profits are maximized: _______________
4 points:
Using a spreadsheet program, plot only revenue and profit on a line graph.
Use a separate line for revenue and a separate line for profit.
Adjust the Y-axis gradations to make sure each line is clearly distinguishable.
Be sure to accurately label the Y-axis (dollars) and the X-axis (years).
Include a graph legend to identify each separate line.
Insert your line graph below:

Step by Step Solution
There are 3 Steps involved in it
Step: 1

Get Instant Access to Expert-Tailored Solutions
See step-by-step solutions with expert insights and AI powered tools for academic success
Step: 2

Step: 3

Ace Your Homework with AI
Get the answers you need in no time with our AI-driven, step-by-step assistance
Get Started


