

Answered step by step
Verified Expert Solution
Question
1 Approved Answer
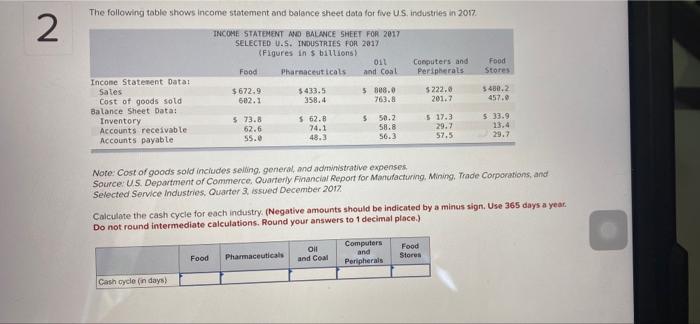
The following table shows income statement and balance sheet data for five US, industries in 2017 2 INCOME STATEMENT AND BALANCE SHEET FOR 2017 SELECTED
Step by Step Solution
There are 3 Steps involved in it
Step: 1

Get Instant Access to Expert-Tailored Solutions
See step-by-step solutions with expert insights and AI powered tools for academic success
Step: 2

Step: 3
Ace Your Homework with AI
Get the answers you need in no time with our AI-driven, step-by-step assistance
Get Started
International Finance A Survey
Authors: H. Kent Baker, Leigh A. Riddick
1st Edition
0199754659, 978-0199754656