Answered step by step
Verified Expert Solution
Question
1 Approved Answer
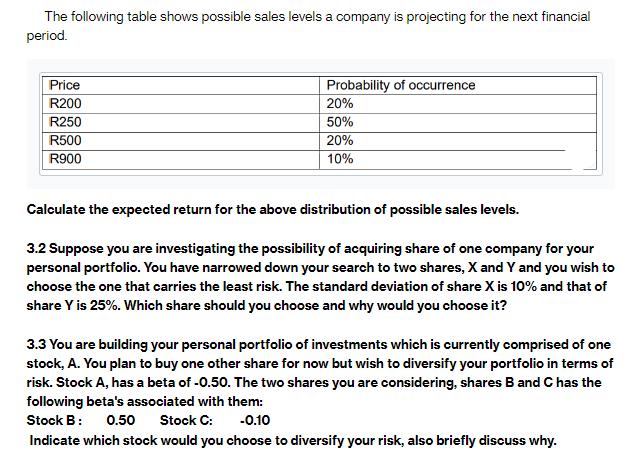
The following table shows possible sales levels a company is projecting for the next financial period. Price R200 R250 R500 R900 Probability of occurrence

The following table shows possible sales levels a company is projecting for the next financial period. Price R200 R250 R500 R900 Probability of occurrence 20% 50% 20% 10% Calculate the expected return for the above distribution of possible sales levels. 3.2 Suppose you are investigating the possibility of acquiring share of one company for your personal portfolio. You have narrowed down your search to two shares, X and Y and you wish to choose the one that carries the least risk. The standard deviation of share X is 10% and that of share Y is 25%. Which share should you choose and why would you choose it? 3.3 You are building your personal portfolio of investments which is currently comprised of one stock, A. You plan to buy one other share for now but wish to diversify your portfolio in terms of risk. Stock A, has a beta of -0.50. The two shares you are considering, shares B and C has the following beta's associated with them: Stock B: 0.50 Stock C: -0.10 Indicate which stock would you choose to diversify your risk, also briefly discuss why.
Step by Step Solution
★★★★★
3.53 Rating (150 Votes )
There are 3 Steps involved in it
Step: 1
SOLUTION To calculate the expected return we need to multiply each possible sales level by its corre...
Get Instant Access to Expert-Tailored Solutions
See step-by-step solutions with expert insights and AI powered tools for academic success
Step: 2

Step: 3

Ace Your Homework with AI
Get the answers you need in no time with our AI-driven, step-by-step assistance
Get Started


