Answered step by step
Verified Expert Solution
Question
1 Approved Answer
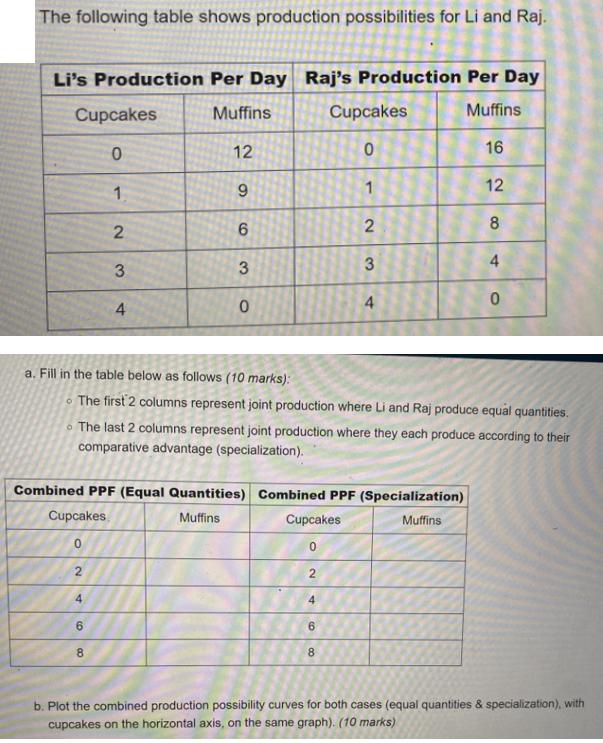
The following table shows production possibilities for Li and Raj. Li's Production Per Day Raj's Production Per Day Muffins Muffins 12 9 Cupcakes 0

The following table shows production possibilities for Li and Raj. Li's Production Per Day Raj's Production Per Day Muffins Muffins 12 9 Cupcakes 0 Cupcakes 0 2 1 2 4 3 a. Fill in the table below as follows (10 marks): 6 4 8 6 3 0 Combined PPF (Equal Quantities) Combined PPF (Specialization) Muffins Muffins The first 2 columns represent joint production where Li and Raj produce equal quantities. The last 2 columns represent joint production where they each produce according to their comparative advantage (specialization). Cupcakes 0 2 Cupcakes 0 4 6 1 2 3 8 4 16 12 8 4 0 b. Plot the combined production possibility curves for both cases (equal quantities & specialization), with cupcakes on the horizontal axis, on the same graph). (10 marks)
Step by Step Solution
There are 3 Steps involved in it
Step: 1

Get Instant Access to Expert-Tailored Solutions
See step-by-step solutions with expert insights and AI powered tools for academic success
Step: 2

Step: 3

Ace Your Homework with AI
Get the answers you need in no time with our AI-driven, step-by-step assistance
Get Started


