Answered step by step
Verified Expert Solution
Question
1 Approved Answer
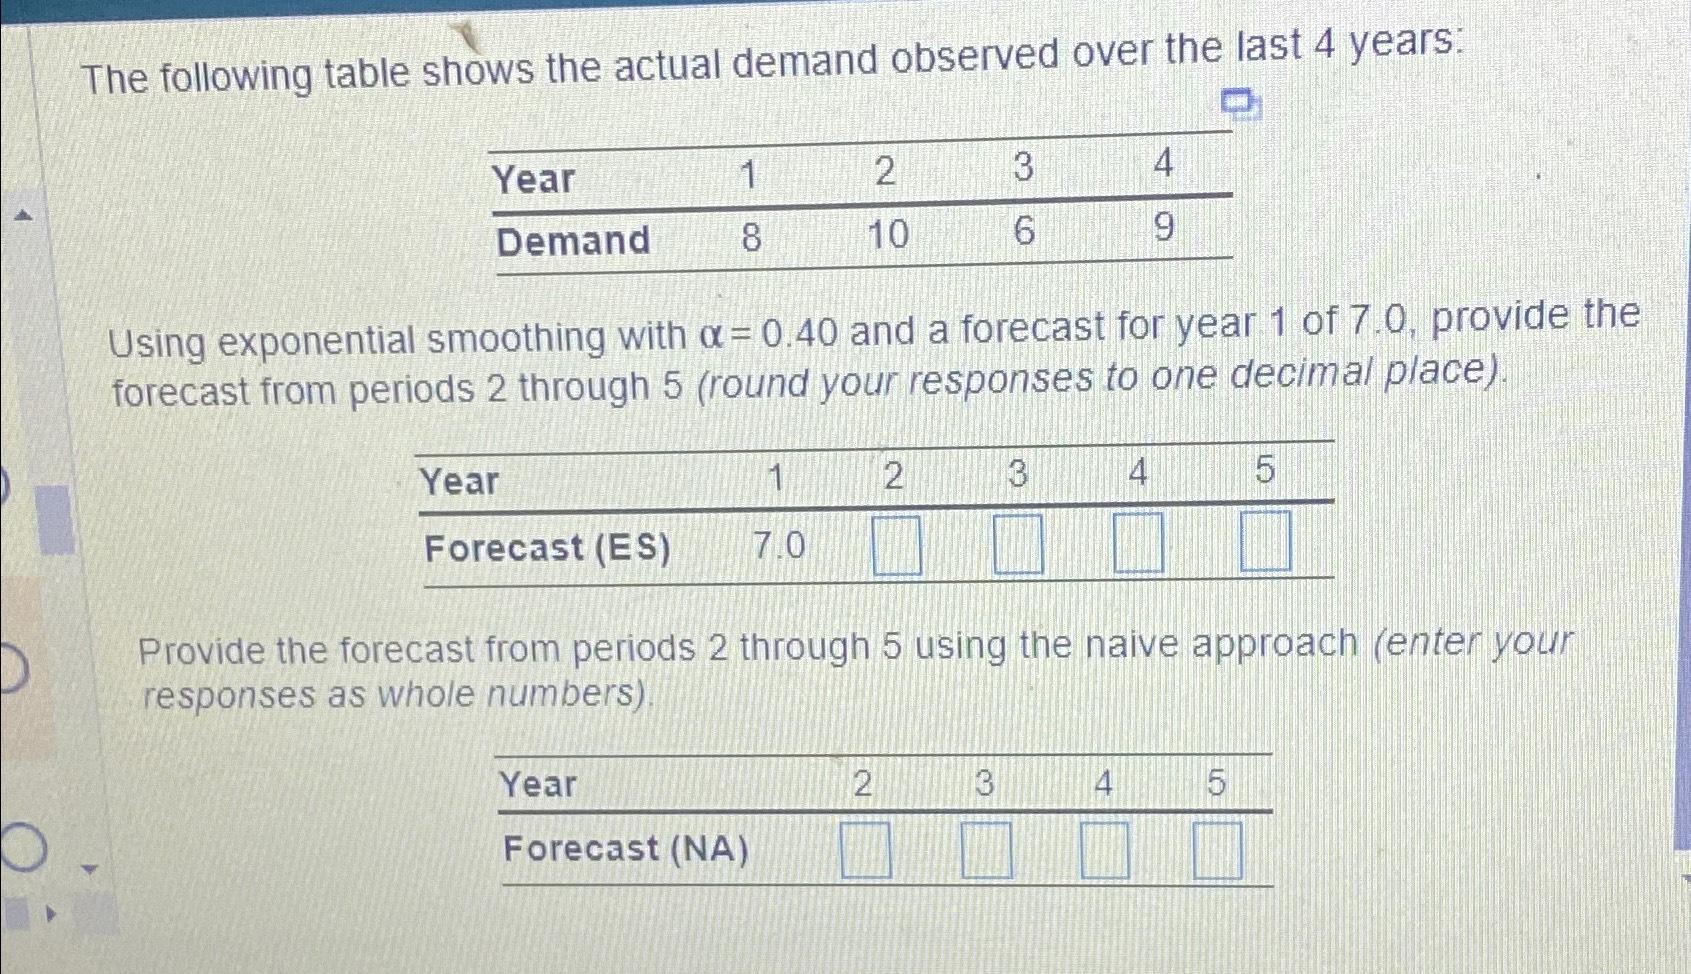
The following table shows the actual demand observed over the last 4 years: table [ [ Year , 1 , 2 , 3 ,
The following table shows the actual demand observed over the last years:
tableYearDemand
Using exponential smoothing with and a forecast for year of provide the forecast from periods through round your responses to one decimal place
tableYearForecast ES
Provide the forecast from periods through using the naive approach enter your responses as whole numbers
tableYearForecast NA

Step by Step Solution
There are 3 Steps involved in it
Step: 1

Get Instant Access to Expert-Tailored Solutions
See step-by-step solutions with expert insights and AI powered tools for academic success
Step: 2

Step: 3

Ace Your Homework with AI
Get the answers you need in no time with our AI-driven, step-by-step assistance
Get Started


