Question
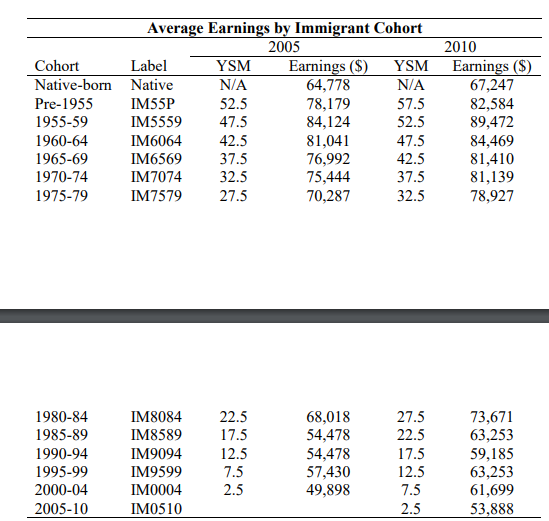
The following table shows the average earnings of various immigrant cohorts and the native born for 2005 and 2010 (all values expressed in 2010 dollars).
The following table shows the average earnings of various immigrant cohorts and the native born for 2005 and 2010 (all values expressed in 2010 dollars). Note: YSM refers to the average years since migration.

a) Calculate the cross-sectional entry effect (in levels) for the 2000-04 cohort.
b)Use the 2005 cross-section to estimate the effect on earnings of being in Canada and additional five years for the 1990-94 cohort; that is, the effect of being in Canada 17.5 instead of 12.5 years. Use this to predict 1990-94's earnings in 2010.
c) Compare your estimate from part (b) to 1990-94's actual earnings in 2010. Provide a better estimate of the earnings assimilation of the 1990-94 cohort. Explain and interpret. Compare this to the cross-sectional estimate from part (b) and suggest an explanation as to why they are different.
Average Earnings by Immigrant Cohort 2005 Cohort Label YSM Earnings ($) YSM Native-born Native N/A 64,778 N/A Pre-1955 IM55P 52.5 78,179 57.5 1955-59 IM5559 47.5 84,124 52.5 1960-64 IM6064 42.5 81,041 47.5 1965-69 IM6569 37.5 76,992 42.5 1970-74 IM7074 32.5 75,444 37.5 1975-79 IM7579 27.5 70,287 32.5 2010 Earnings ($) 67,247 82,584 89,472 84,469 81,410 81,139 78,927 22.5 17.5 12.5 1980-84 1985-89 1990-94 1995-99 2000-04 2005-10 IM8084 IM8589 IM9094 IM9599 IM0004 IM0510 68,018 54,478 54,478 57,430 49,898 27.5 22.5 17.5 12.5 7.5 73,671 63,253 59,185 63,253 61,699 53,888 7.5 2.5 2.5 Average Earnings by Immigrant Cohort 2005 Cohort Label YSM Earnings ($) YSM Native-born Native N/A 64,778 N/A Pre-1955 IM55P 52.5 78,179 57.5 1955-59 IM5559 47.5 84,124 52.5 1960-64 IM6064 42.5 81,041 47.5 1965-69 IM6569 37.5 76,992 42.5 1970-74 IM7074 32.5 75,444 37.5 1975-79 IM7579 27.5 70,287 32.5 2010 Earnings ($) 67,247 82,584 89,472 84,469 81,410 81,139 78,927 22.5 17.5 12.5 1980-84 1985-89 1990-94 1995-99 2000-04 2005-10 IM8084 IM8589 IM9094 IM9599 IM0004 IM0510 68,018 54,478 54,478 57,430 49,898 27.5 22.5 17.5 12.5 7.5 73,671 63,253 59,185 63,253 61,699 53,888 7.5 2.5 2.5Step by Step Solution
There are 3 Steps involved in it
Step: 1

Get Instant Access to Expert-Tailored Solutions
See step-by-step solutions with expert insights and AI powered tools for academic success
Step: 2

Step: 3

Ace Your Homework with AI
Get the answers you need in no time with our AI-driven, step-by-step assistance
Get Started


